People who follow the RRG Charts blog and my other articles in the ChartWatchers newsletter, as well as this Don't Ignore This Chart blog, will know that I like a top-down, structured approach to markets. The starting point for this approach is always the Asset Allocation universe, which is pre-defined in the dropdown selection box on the RRG-page.
In the past week I received an email from somebody who watches my Sector Spotlight show on StockCharts TV, airing every Tuesday at 10.30am ET. One of the questions was why I used IEF, the 7-10 year Treasury Bond ETF, as the proxy for Government bonds, especially as I tend to use IEI, the 3-7 year Treasury Bond ETF, as the benchmark for the RRG showing the rotations for various segments of the yield curve.
In short, these two universes, or layers in the investment pyramid, did not align.
GOVT for IEF and ITOT for SPY
The solution to solve this was simple (also suggested in that Email): use GOVT, the iShares Core US Treasury Bond ETF. This ETF covers all maturities from 1-30 years, with an effective duration of 6.5 years.
A similar point was raised with respect to using SPY as the proxy for the asset class "stocks," arguing that there are many more stocks than the 500 large caps covered by SPY. And, again, this makes sense.
The chosen solution here is to swap SPY for ITOT. This ETF tracks the S&P Total Market Index, which covers the broad equity market (including large-, mid- and micro-cap stocks). Substituting SPY for ITOT in the Asset Allocation Process also enables bringing the separation between large-, mid- and small-caps (and even micro-caps) into the mix.
Therefore, from today onwards, when you open the Asset Allocation universe from the dropdown selection box on RRG, you will see ITOT and GOVT instead of SPY and IEF.

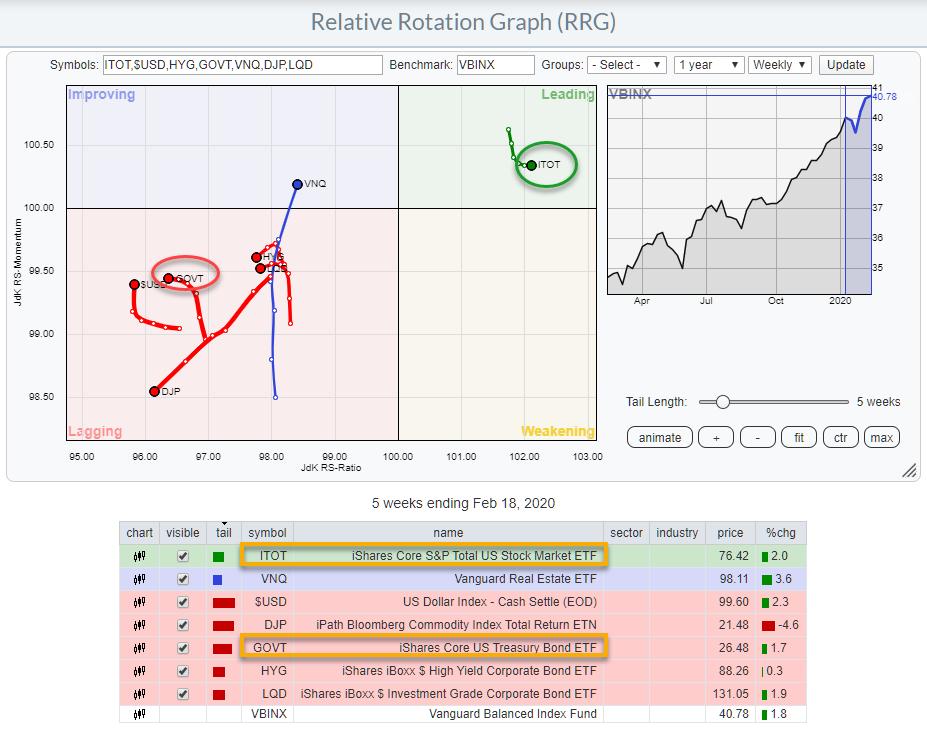
The Relative Rotation Graph below holds only ITOT, SPY, IEF and GOVT vs. VBINX to compare their tails.

As you can see, both ITOT and SPY and GOVT and IEF are more or less at the same positions, with their tails slightly different but, by-and-large, following similar paths. This means that recent analyses are still valid, preferring stocks over government bonds.
Using this setup allows for a(n even) more layered approach going forward!
-- Julius
My regular blog is the RRG Charts blog. If you would like to receive a notification when a new article is published there, simply "Subscribe" with your email address.
Julius de Kempenaer
Senior Technical Analyst, StockCharts.com
Creator, Relative Rotation Graphs
Founder, RRG Research
Want to stay up to date with the latest market insights from Julius?
– Follow @RRGResearch on Twitter
– Like RRG Research on Facebook
– Follow RRG Research on LinkedIn
– Subscribe to the RRG Charts blog on StockCharts
Feedback, comments or questions are welcome at Juliusdk@stockcharts.com. I cannot promise to respond to each and every message, but I will certainly read them and, where reasonably possible, use the feedback and comments or answer questions.
To discuss RRG with me on S.C.A.N., tag me using the handle Julius_RRG.
RRG, Relative Rotation Graphs, JdK RS-Ratio, and JdK RS-Momentum are registered trademarks of RRG Research.
Julius de Kempenaer
Senior Technical Analyst, StockCharts.com
Creator, Relative Rotation Graphs
Founder, RRG Research
Host of: Sector Spotlight
Please find my handles for social media channels under the Bio below.
Feedback, comments or questions are welcome at Juliusdk@stockcharts.com. I cannot promise to respond to each and every message, but I will certainly read them and, where reasonably possible, use the feedback and comments or answer questions.
To discuss RRG with me on S.C.A.N., tag me using the handle Julius_RRG.
RRG, Relative Rotation Graphs, JdK RS-Ratio, and JdK RS-Momentum are registered trademarks of RRG Research.