 Towards the end of May, the US stock market ($SPX) started to lose relative strength vs. other major world market stock indexes.
Around that time the $SPX tail vs. $DJW, the Dow Jones Global Index, rolled over inside the leading quadrant and started to rotate into and through weakening. This move has, and still is, continuing. The table below the RRG (inset) shows that the US over the last 13 weeks underperformed the Global Index by 1.5%; 18% gain vs. 19.5% for the world.
Not a massive underperformance, but, as you can see, there are quite a few markets that have done (a lot) better than the US over this period of time.
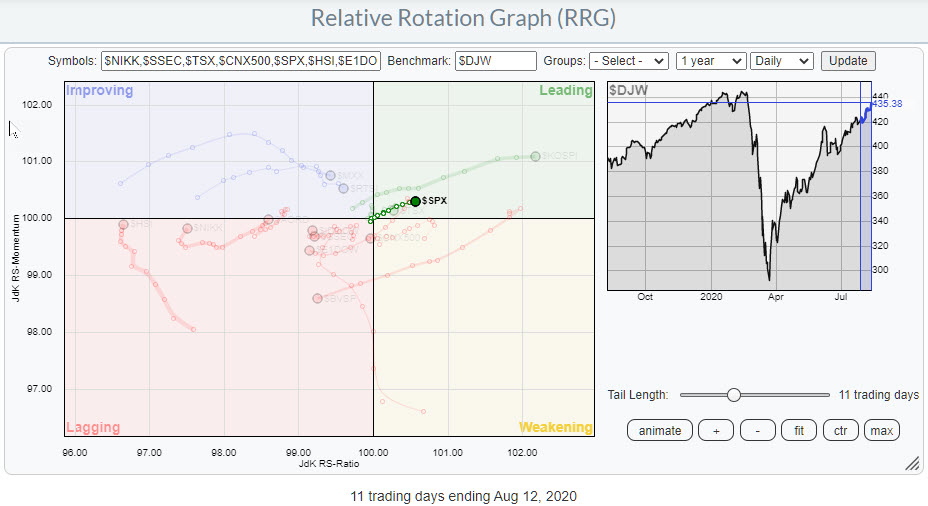
That situation seems to be coming to an end now. As you can see on the daily RRG at the top of the article. $SPX has turned back into the leading quadrant together with $KOSPI and $TSX.
The weekly tail on $SPX, while still inside weakening, has started to show improvement and is curling upward. For the US to get back firmly in the lead again vs. the world, the tail on the daily RRG needs to grow and get longer, which expresses power/momentum of the move, and continue to travel at an RRG-Heading between 0-90 degrees.

A break above resistance between 3385-3395 - the cluster of highs in February just before the market started to tank - will certainly help and confirm the current strength.
Such a break will be crucial to regain leadership vs. the rest of the world.
#StaySafe, --Julius
My regular blog is the RRG Chartsblog. If you would like to receive a notification when a new article is published there, simply "Subscribe" with your email address.
Julius de Kempenaer
Senior Technical Analyst, StockCharts.com
Creator, Relative Rotation Graphs
Founder, RRG Research
Host of: Sector Spotlight
Please find my handles for social media channels under the Bio below.
Feedback, comments or questions are welcome at Juliusdk@stockcharts.com. I cannot promise to respond to each and every message, but I will certainly read them and, where reasonably possible, use the feedback and comments or answer questions.
To discuss RRG with me on S.C.A.N., tag me using the handle Julius_RRG.
RRG, Relative Rotation Graphs, JdK RS-Ratio, and JdK RS-Momentum are registered trademarks of RRG Research.