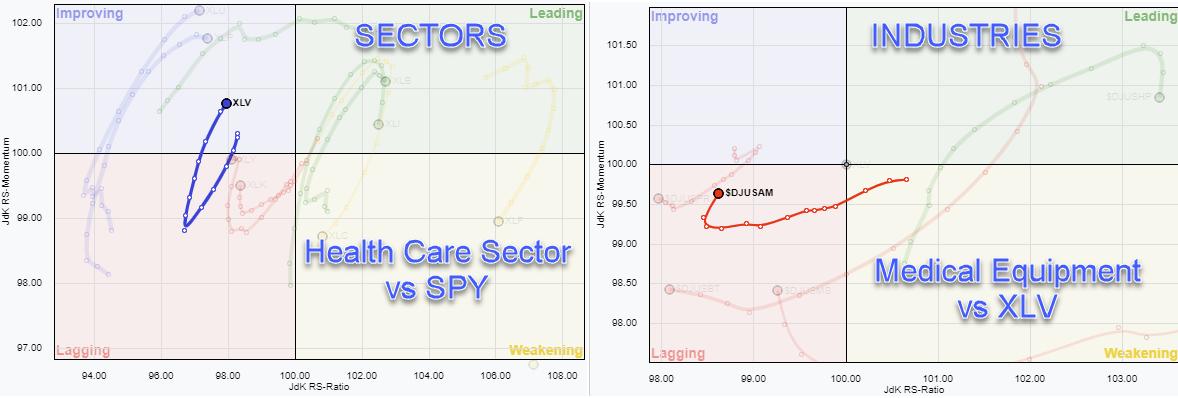
The Health Care sector is one of the defensive sectors in the S&P 500 which is on a positive trajectory inside the improving quadrant and heading towards leading. The RRG for sectors, highlighting XLV, is on the left above.
The RRG on the right shows the industries inside the Health Care sector against XLV, with the Medical Equipment group $DJUSAM highlighted. As you can see, the tail is still inside the lagging quadrant, but has started to curl back up and travel at a positive RRGH-Heading. By the way, when you plot these industries directly against SPY, pretty much all of them are at a strong RRG-Heading, and Medical Equipment is already well inside the leading quadrant.
Working our way further top-down, the next chart is the RRG of the members of the Medical Equipment group against the Medical Equipment Index.
One of the stocks that is worth a closer look at is Agilent Technologies (A), which is inside the weakening quadrant, but has started to improve again after a downward rotation and is now on its way back towards the leading quadrant.

Looking at the price chart above in combination with relative strength confirms the bullish outlook for this stock. Price is moving inside the boundaries of a rising channel and currently about to break resistance offered by two of its recent highs around $ 137. Once Agilent can clear that overhead barrier, a further rise is likely. This will also have a positive impact on the relative strength of A vs. SPY and XLV.
In the panes below the price chart, I have plotted the raw RS of A and the resulting RRG-Lines against SPY, XLV, and $DJUSAM.
The upward break in RS vs the industry is clearly visible. This will most likely drive a further improvement of relative strength vs. the sector (XLV) and ultimately versus the market (SPY).
#StaySafe, --Julius
My regular blog is the RRG Charts blog. If you would like to receive a notification when a new article is published there, simply "Subscribe" with your email address.
Julius de Kempenaer
Senior Technical Analyst, StockCharts.com
Creator, Relative Rotation Graphs
Founder, RRG Research
Host of: Sector Spotlight
Please find my handles for social media channels under the Bio below.
Feedback, comments or questions are welcome at Juliusdk@stockcharts.com. I cannot promise to respond to each and every message, but I will certainly read them and, where reasonably possible, use the feedback and comments or answer questions.
To discuss RRG with me on S.C.A.N., tag me using the handle Julius_RRG.
RRG, Relative Rotation Graphs, JdK RS-Ratio, and JdK RS-Momentum are registered trademarks of RRG Research.