Running scans as part of your daily trading routine can reveal surprising trading candidates. Alphabet, Inc. stock is well-loved among investors and a massive component of the S&P 500 index. But GOOGL has struggled. Will it break through a critical resistance level?
After running a scan identifying large-cap stocks, using a StockCharts Technical Ranking (SCTR) score crossing above 76 as a criterion, one of the names that appeared in the results was Alphabet, Inc. (GOOGL). Let's take a closer look at the chart of GOOGL (see chart below).
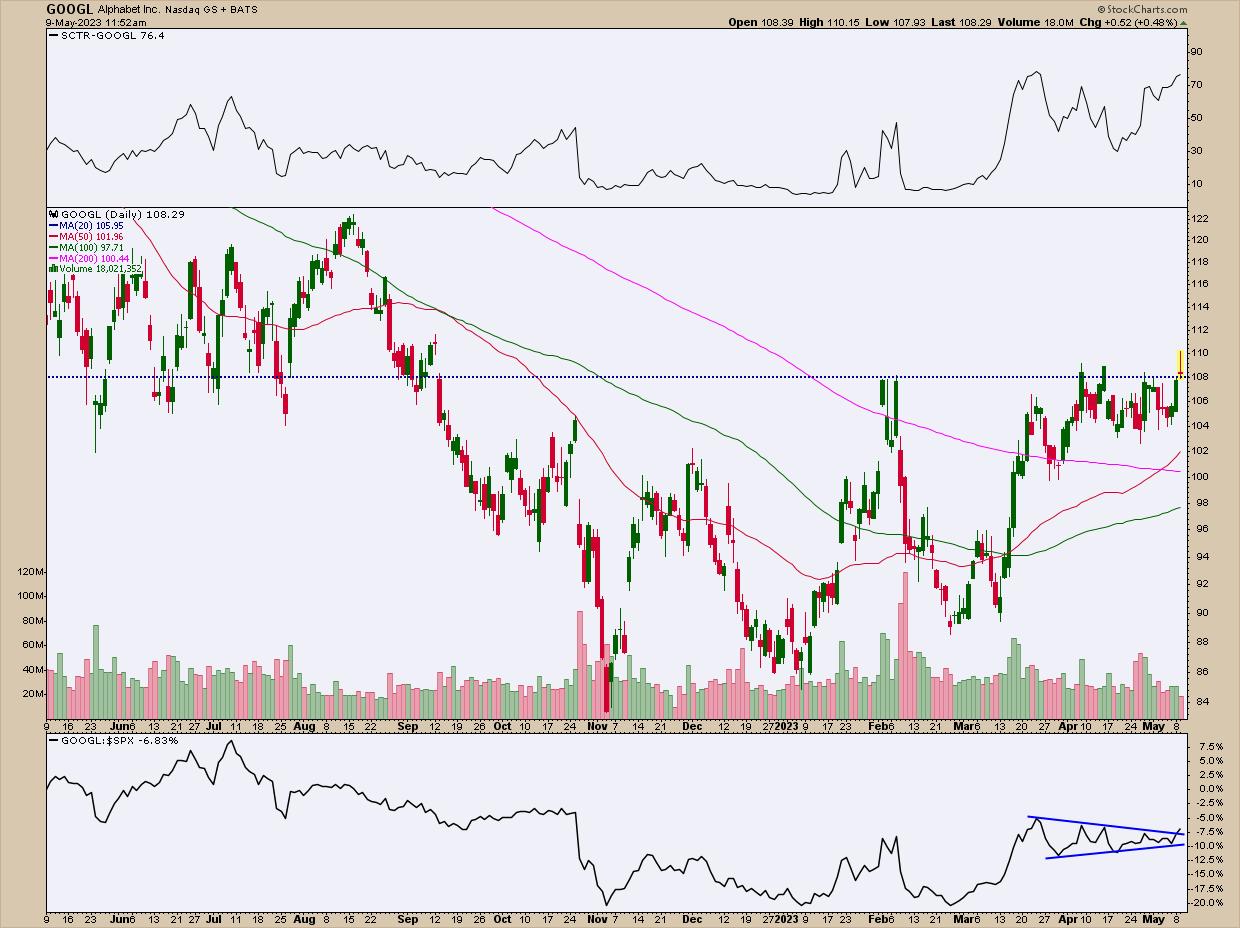
CHART 1: WILL GOOGL BREAK ABOVE $108 AND MOVE HIGHER? That remains to be seen, but the stock is showing strength, which could work in its favor.Chart source: StockCharts.com. For educational purposes only.
After falling to a low in early November 2022, the stock has struggled to resume its uptrend. It's been trading pretty much sideways since then, having a tough time breaking above the $108 level (blue-dashed line). Every time GOOGL went above $108, it quickly went lower. Will its +108 last more than a day this time?
Zeroing In: Daily Price Action
If you look at the last few times the stock price hit the $108 level, the SCTR level was below 76, except on March 23, when price didn't quite reach the $108 level. A cross above the 76 SCTR level indicates the stock is gaining strength and, if it crosses above 78 and 80, that's an indication of a continuation of the strength. When the scan was run, the SCTR for the stock crossed above 80, although it pulled back a bit during the trading day. It's still above 76, though.
Another point to note during previous $108 breaches: GOOGL's relative performance against the S&P 500 index ($SPX) was lagging. It still is, but this time, there's a sort of triangle pattern forming (see lower chart panel). If GOOGL's relative strength with respect to the S&P 500 continues to increase, the stock could get closer to its next resistance level.
A Weekly Perspective
If you look at the weekly chart, the next resistance level could be the 100-week moving average, or $118.64 (green dashed line). A follow-through from that level could take the stock as high as its November 2021 high.

CHART 2: WEEKLY CHART OF GOOGL. The stock could trade up toward its 100-week moving average or it could fall towards the bottom of its most recent trading range or to its 50-week moving average. Chart source: StockCharts.com. For educational purposes only.
A reversal in the SCTR score and underperformance against the S&P 500 index could send the stock lower, either towards the bottom of its most recent trading range at around $104 or to its 50-week moving average.
How to Trade GOOGL
- If the stock price stays above $108 for more than a day and there's upside follow-through, the SCTR score stays above the 70 level, and the stock's performance against the benchmark S&P 500 continues to strengthen, this stock has the potential to move higher. If these conditions are met, you could set an entry point slightly above $108.
- On the flip side, if price slides back below $108, the SCTR score crosses below 70, and relative strength falters, GOOGL could resume its sideways choppiness. If losing $4.00 on the trade is acceptable, you could place a stop-loss at the $104 level, the bottom of the stock's most recent trading range. Or you could place a stop at or just below the 50-week moving average (red line).
Other Stocks From the Scan
Wondering what other stocks showed up on the SCTR? Here's a handful.
- Cardinal Health, Inc. (CAH)
- Netflix, Inc. (NFLX)
- Palantir Technologies, Inc. (PLTR)
- Snowflake Inc. (SNOW)
- Vertex Pharmaceuticals, Inc. (VRTX)
Looking Back at BSX
On April 25, Boston Scientific (BSX) was the featured SCTR scan candidate. Let's look at how that stock is performing.

CHART 3: A LOOK AT A PREVIOUS SCAN CANDIDATE. Boston Scientific's stock is still a candidate to keep an eye on. A breakthrough above the trendline on above-average volume could push the stock higher.Chart source: StockCharts.com. For illustrative purposes only.
SCTR level is still well above the 70 level and the stock's performance relative to the Health Care sector remains strong. What has changed is that steep trendline, which the stock seems reluctant to break through. There's still a chance it may, although the price is moving within the $51.50 to $53.50 range. It may be worth adding volume to your chart, because an upward breakout on strong volume could prove promising for Boston Scientific. Continue monitoring the stock.
SCTR Crossing Scan
[country is US] and [sma(20,volume) > 100000] and [[SCTR.large x 76] or [SCTR.large x 78] or [SCTR.large x80]]
Credit goes to Greg Schnell, CMT, MFTA.
Disclaimer: This blog is for educational purposes only and should not be construed as financial advice. The ideas and strategies should never be used without first assessing your own personal and financial situation, or without consulting a financial professional.

Happy charting!