TAKEAWAYS
- LUV stock has broken a downward sloping trendline on the weekly chart
- LUV's stock price has been gaining altitude rapidly since May
- LUV could be a potential buy if the stock's price holds the 200-day moving average

After a busy holiday travel weekend, it shouldn't be a surprise to see airline stocks take off.
One of the stocks that showed up in the StockCharts Technical Ranking (SCTR) scan is Southwest Airlines (LUV). The stock also happens to be one that our chief market strategist, David Keller, CMT, picked in his top 10 stocks in a recent episode of StockCharts TV's The Final Bar. (Specifically, a two-part episode where Dave Keller and Grayson Roze shared their top stock picks.) The airline industry has had its shares of problems, but the travel/leisure industry is starting to gain momentum. Is this a good time to own LUV stock?
The Big Picture: Looking at the Airline Industry
Airlines report earnings later in July, and it's worth keeping an ear open when airlines report. Southwest reports at the end of July, but earnings from competitors who report earlier—Delta Air Lines, Inc. (DAL) and United Airlines Holdings, Inc. (UAL)—could set the stage for LUV.
The weekly chart of the Airline Index ($XAL) below shows that, after recovering from 2020 to 2021, the index trended lower until October 2022. From there, the chart shows higher lows and higher highs. In June, the index moved up quickly.
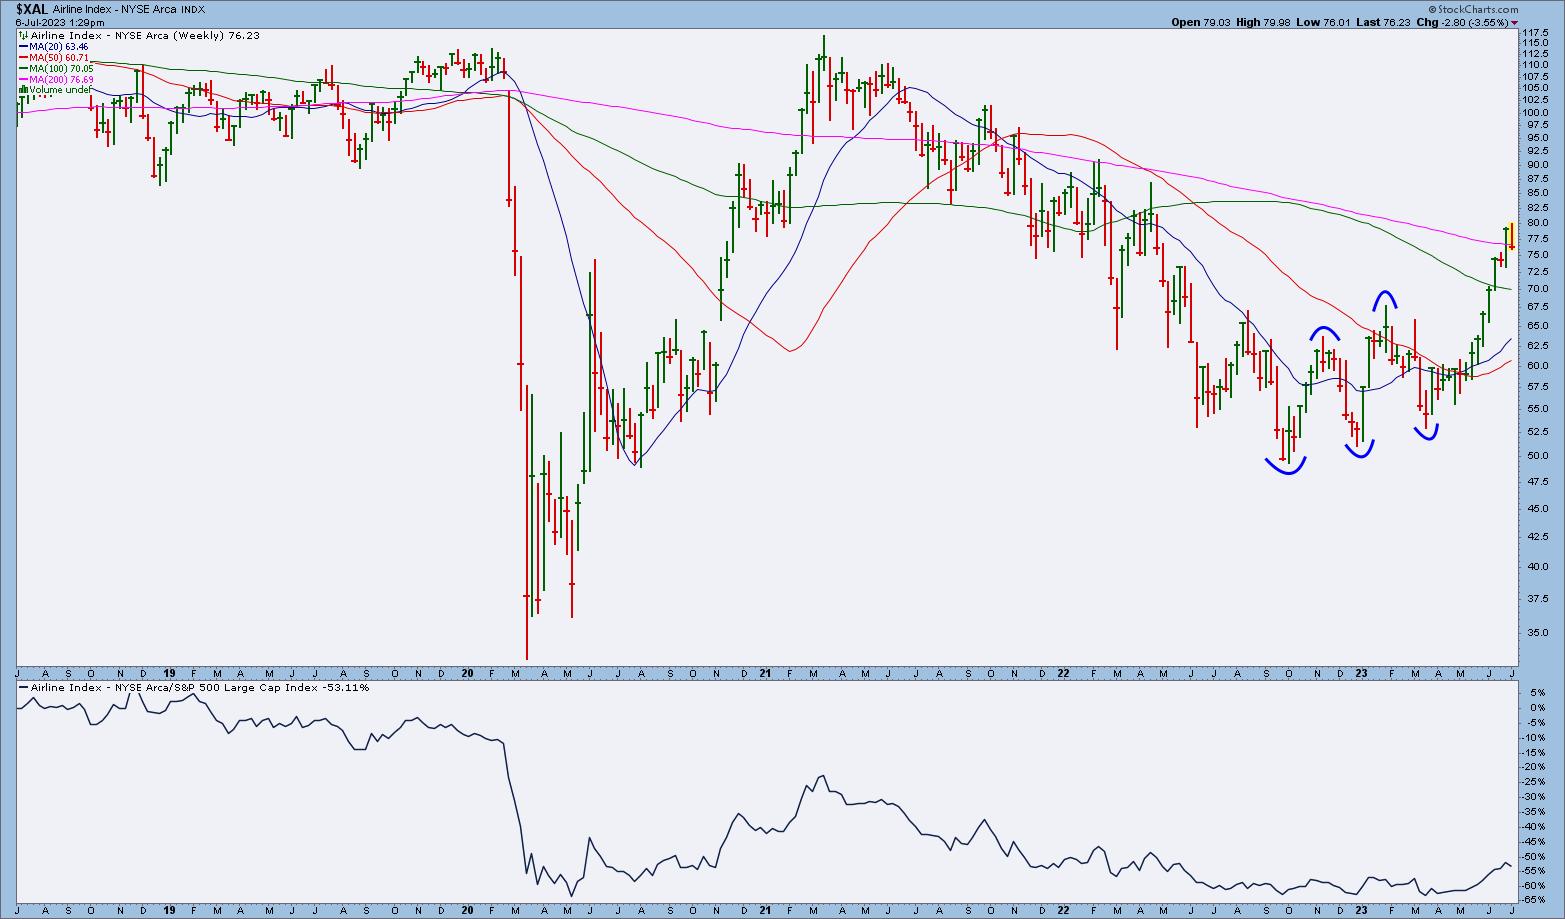
CHART 1: A LOOK AT THE AIRLINE INDUSTRY. The overall industry has started trending higher and broke above the 200-week simple moving average. However, it has pulled back, and it'll be interesting to see if it bounces off the 200-week SMA.Chart source: StockCharts.com (click on chart for live version). For educational purposes only.
After crossing above the 20-week simple moving average (SMA), $XAL has been moving higher in a relatively steep slope, moving above the 100- and 200-week SMAs. But after crossing the 200-week SMA, $XAL pulled right back to it. This may have been based on the news of Jet Blue Airways (JBLU) ending its partnership with American Airlines Group (AAL). It remains to be seen if $XAL bounces off this level and resumes its uptrend.
It's worth noting that the index has a ways to go before reaching previous highs around the $114.50 level. With that in mind, let's bring up a weekly chart of LUV.

Stay on top of earnings with the StockCharts Earnings Calendar. From Your Dashboard, scroll through the Member Tools and click on Earnings Calendar. Select Upcoming Earnings > enter LUV in the search box on the right. From here, you can view stock price charts, add the symbol to your ChartList, set an alert for the stock, and much more.
A Weekly Perspective of LUV
The weekly chart (see below) shows Southwest's stock has been in a clear downtrend since April 2021. But, in late June, the stock price broke above the downward-sloping trendline (blue solid line). The next area where the stock could face potential headwinds is its 100-week SMA. The relative strength (lower panel), shows that the stock is lagging in performance relative to the S&P 500 index ($SPX).
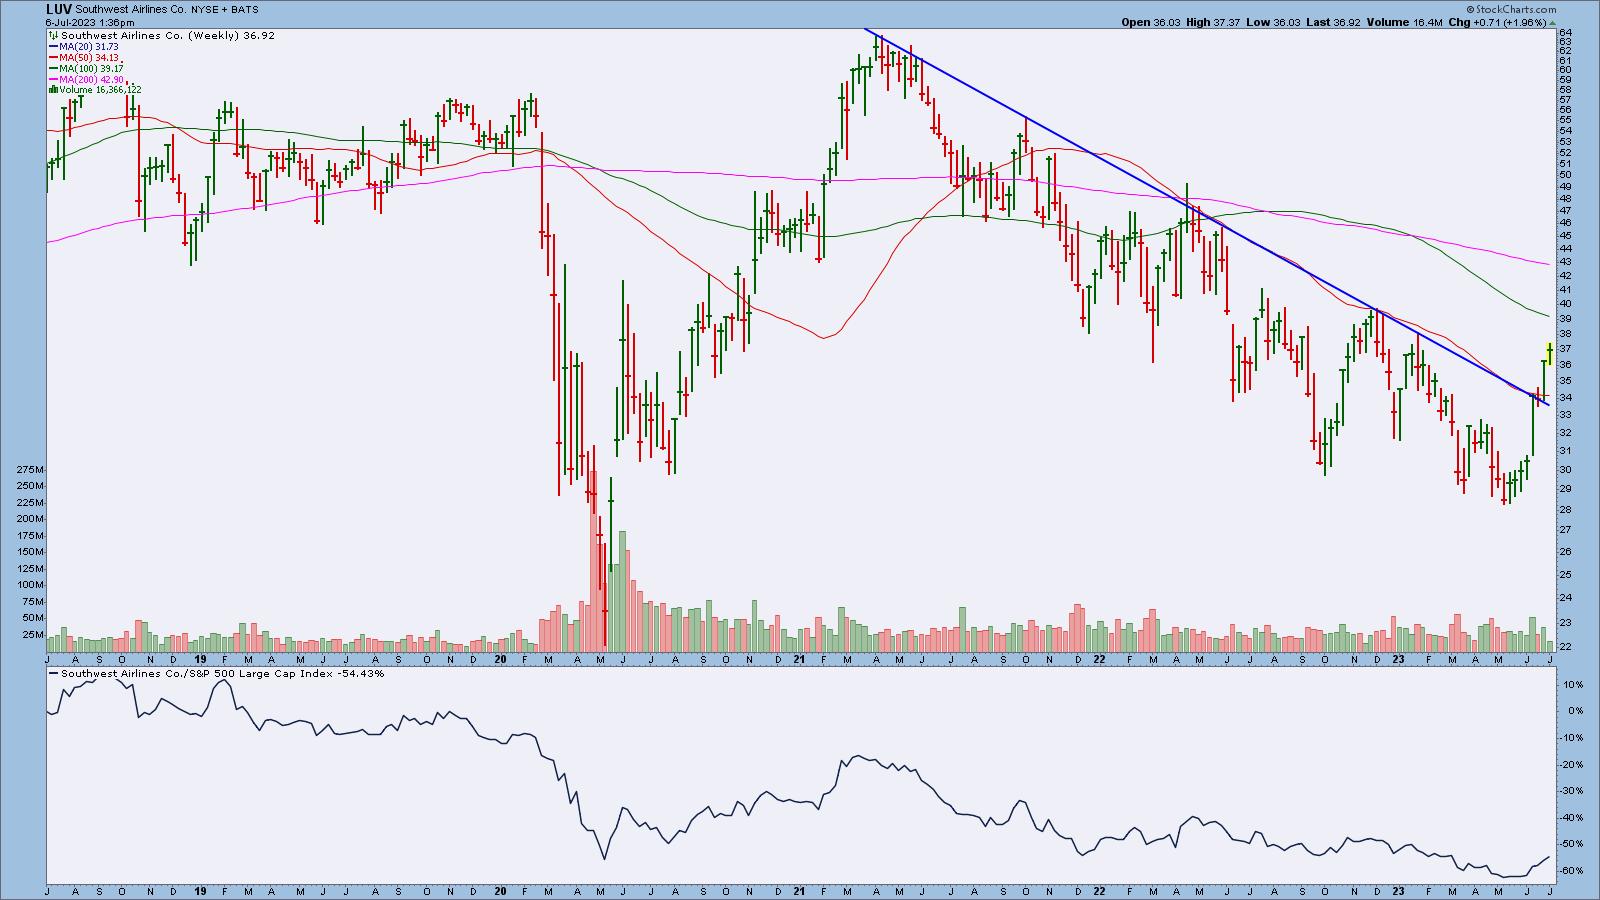
CHART 2: WEEKLY CHART OF LUV STOCK. The stock has broken above a downward-sloping trendline after retesting previous lows. Is this the beginning of a trend reversal? Look for a pattern of higher highs and higher lows.Chart source: StockCharts.com. For educational purposes only.
One point to note—mentioned in the video—is that LUV retested its 2020 low. Although it didn't get as low as the absolute 2020 low, it came pretty close to it. If tailwinds are in LUV's favor, the stock's price could continue to trend higher.
Zeroing In: Daily Price Action in LUV
The daily chart shows much more choppiness than the weekly chart, but, since mid-May, the stock has quickly gained altitude (see chart below). It's trading above its 200-day SMA, so it looks like an open sky for the stock to soar higher.
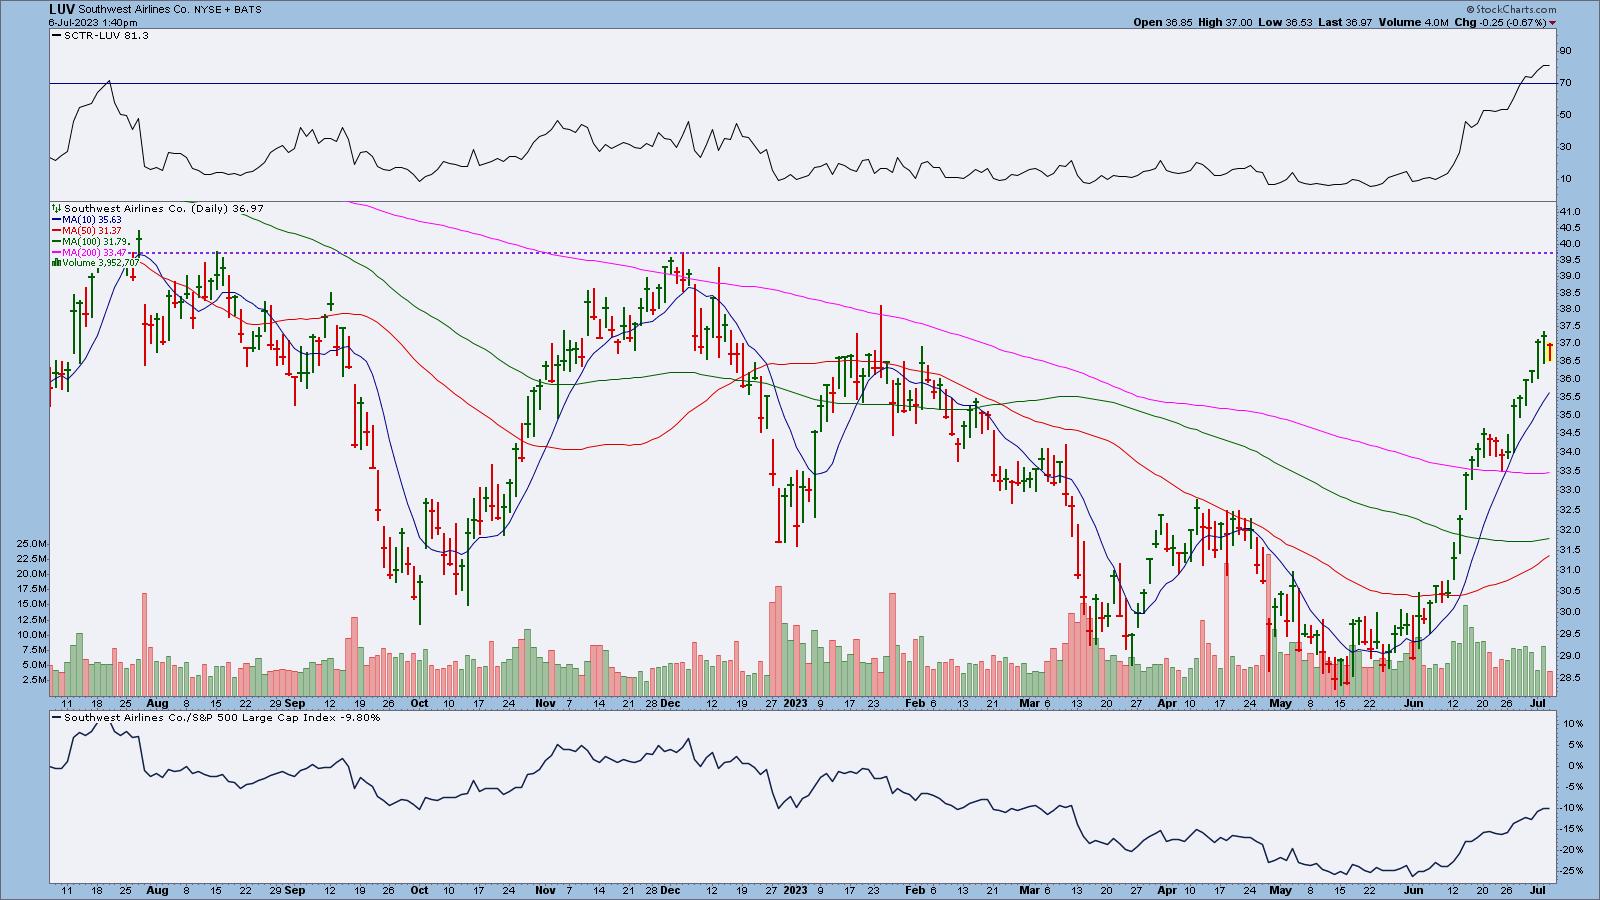
CHART 3: DAILY CHART OF LUV. It's critical that the stock's price stays above the 200-day SMA. A break below it could invalidate the uptrend.Chart source: StockCharts.com. For educational purposes only.Now that the stock has broken above its 200-day SMA, it'll be crucial to see if it holds at that level. The price is a long way from there, but, as you know too well, price drops can happen quickly, especially on negative news.
The chart shows that $39.70 is an area where the stock could hit some turbulence. If you go back further, say a two-year timeframe, this was a support level in 2021 and 2022. After that, it was a resistance level. If it gets there, it remains to be seen if LUV stock will break through this level. There's a lot of upside room for this stock.
Here are a couple of points that support an up move in LUV:
- The SCTR is above 70.
- Relative strength with respect to the S&P 500 index ($SPX) is relatively low, although it's looking like it's trending higher.
So, How Should You Trade LUV Stock?
After breaking above the 200-day SMA, LUV pulled back and bounced off the SMA, and moved on up. But the volume hasn't been too strong. So, how should you approach trading this stock?
- Wait for above-average volume before opening a long position. Ideally, this would be after a pullback. But what level would be resistance for the stock?
- Since the stock has had a steep rise, it would make sense to add a short moving average that closely follows the upward move. In this case, a 10-day SMA was applied to the price chart. That could be the first support level.
- The 200-day SMA is still trending downward. A reversal in direction would be positive for the stock and serve as a longer-term support level if the stock moved higher. If you are considering a longer-term trade, turn to the weekly chart and make sure that the 100- and 200-week SMAs are turning upward. Also, look for higher highs and higher lows.
Other Stocks From the Scan
Here are some other stocks and ETFs that showed up on the large-cap SCTR scan.
- Alphabet Inc./Alphabet Inc. - Class C (GOOGL/GOOG)
- CrowdStrike Holdings, Inc. (CRWD)
- Global X Lithium ETF (LIT)
- iShares S&P 500 Value ETF (IVE)
- Rivian Automotive (RIVN)
- Snap Inc. (SNAP)
Looking Back at LULU
In last week's SCTR scan article, the featured stock was Lululemon (LULU). Let's look at how that stock is performing.
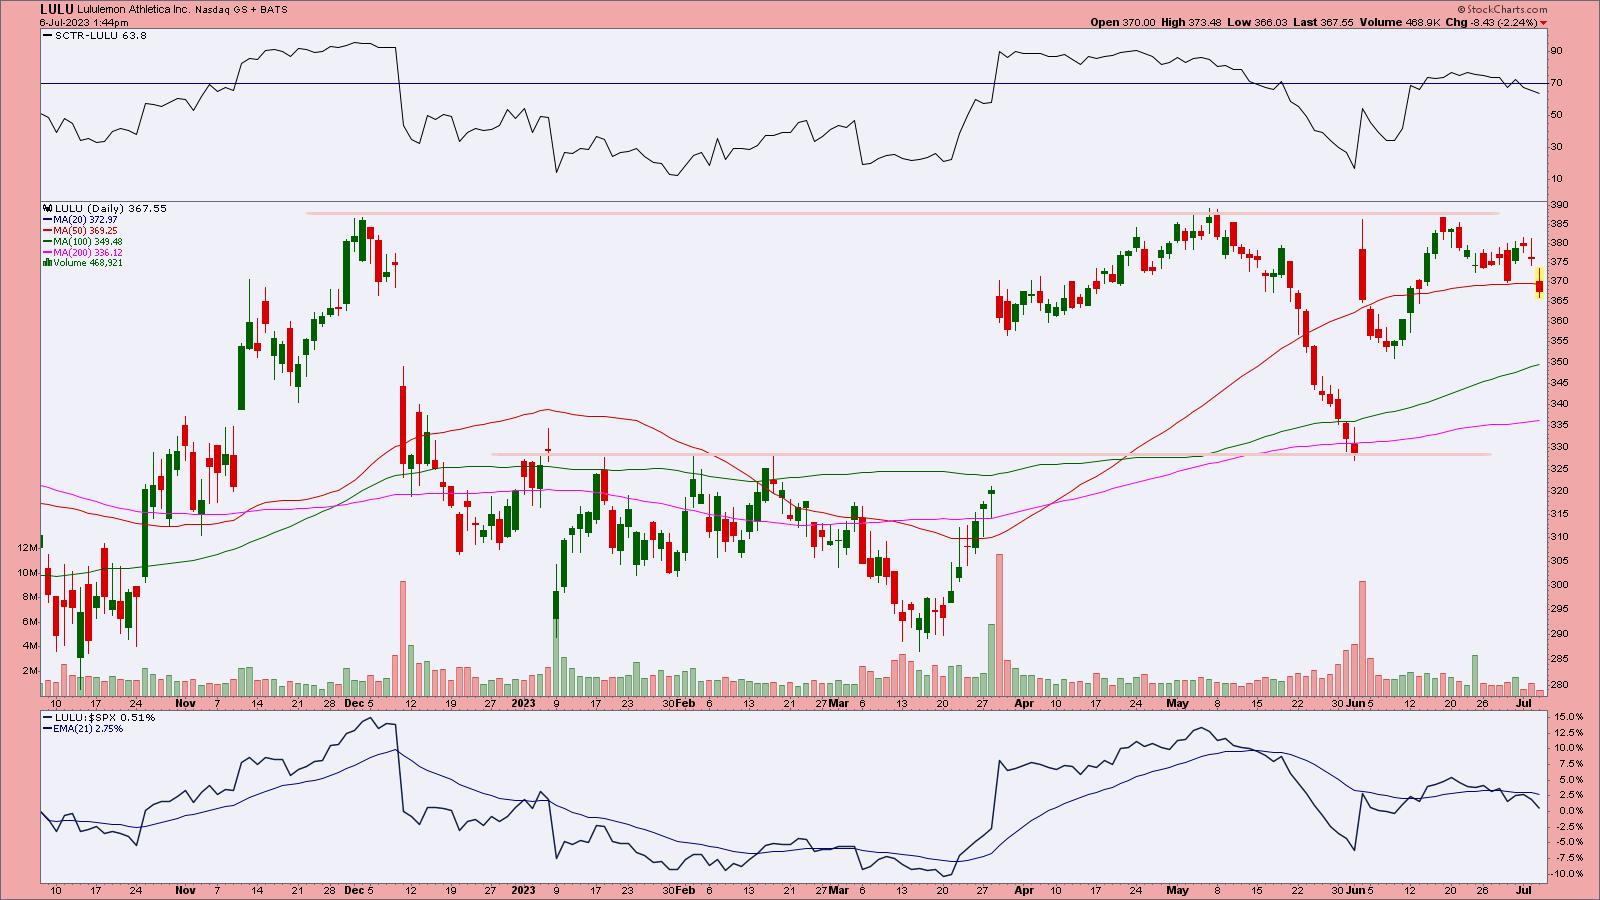
CHART 4: DAILY CHART OF LULU STOCK. The stock is trading below its 50-day SMA. If it goes as low as or lower than the 200-day SMA, it could fill the most recent large gap. Momentum has also slowed.Chart source: StockCharts.com. For educational purposes only.
LULU has broken below its 50-day SMA. The next support level is the 100-day SMA, and if the stock price falls to that level, it could fall further to fill the previous gap. The SCTR has fallen below 70, and LULU's relative strength with respect to $SPX is trending lower.
This is a challenging stock to trade. If the stock price falls, it could follow past patterns and gap up significantly. If you enjoy trading stocks with big up and down gaps, keep an eye on volume. If it spikes, it could indicate a big up or down move. If you can't stomach erratic price moves, it may be better to move on to something more in line with your risk tolerance level.
SCTR Crossing Scan
[country is US] and [sma(20,volume) > 100000] and [[SCTR.us.etf x 76] or [SCTR.large x 76] or [SCTR.us.etf x 78] or [SCTR.large x 78] or [SCTR.us.etf x 80] or [SCTR.large x 80]]
Credit goes to Greg Schnell, CMT, MFTA.

Disclaimer: This blog is for educational purposes only and should not be construed as financial advice. The ideas and strategies should never be used without first assessing your own personal and financial situation, or without consulting a financial professional.
Happy charting!