TAKEAWAYS
- Costco experienced a significant rally driven by strong earnings and an upgraded analyst target of $700
- Despite COST's bullish prospects, the stock is overbought and is likely to pull back
- Setting price alerts at several support levels may be key to finding a strong long entry point

Shares of Costco (COST) rallied over 3% Monday on huge volume, fueled by last week's strong earnings and a prominent Wall Street analyst upgrade, which raised the share price target to $700. COST is one of the strongest retailers in the industry, and the holiday season is likely to boost its sales further. That said, the price of $700 a share seems well within COST's reach.
Running a scan for Strong Volume Gainers on Monday brought COST to our attention, and, with a SCTR score of 88.6, it seemed like an attractive prospect. But after looking at its trajectory, it becomes clear the stock was parabolic; well overbought and due for a decent-sized pullback.
Still, investors seemed ultra-bullish on the stock. And there are many fundamental reasons supporting its bullish outlook. So, as it pulls back, the challenge is to find a favorable entry point. Let's take a look, starting with the big picture (see weekly chart of COST below).
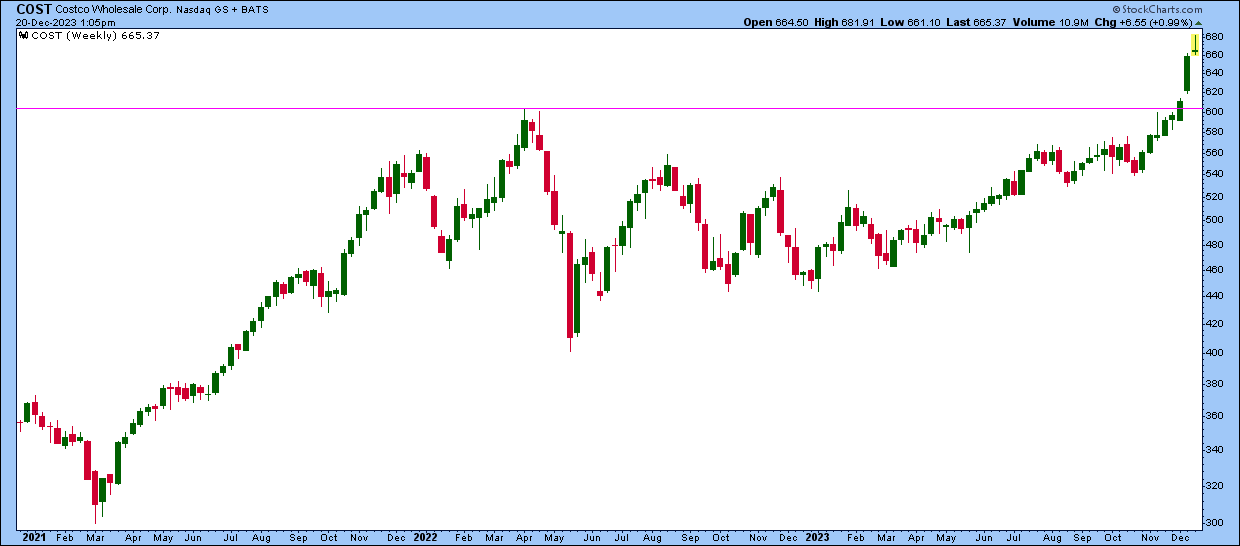
CHART 1: WEEKLY CHART OF COSTCO. Note the parabolic rise beyond the 2022 high and the shooting star forming in the current week, indicating a reversal.Chart source: StockCharts.com. For educational purposes.
After bottoming from the 2021 COVID crash, COST saw little impact from the pandemic lockdown that followed. In 2022, as inflation began hitting customers' pocketbooks, COST maintained a narrowing range, which steadily broke to the upside before going parabolic over the last three weeks, breaking resistance at $603 (see magenta line) and soaring into the all-time high territory. The current week shows a Shooting Star candlestick pattern, indicating a bearish reversal.
As bullish as COST's prospects might be, it's due for a pullback. And now it's a matter of anticipating where COST might bounce. Let's look at a daily chart (see below).
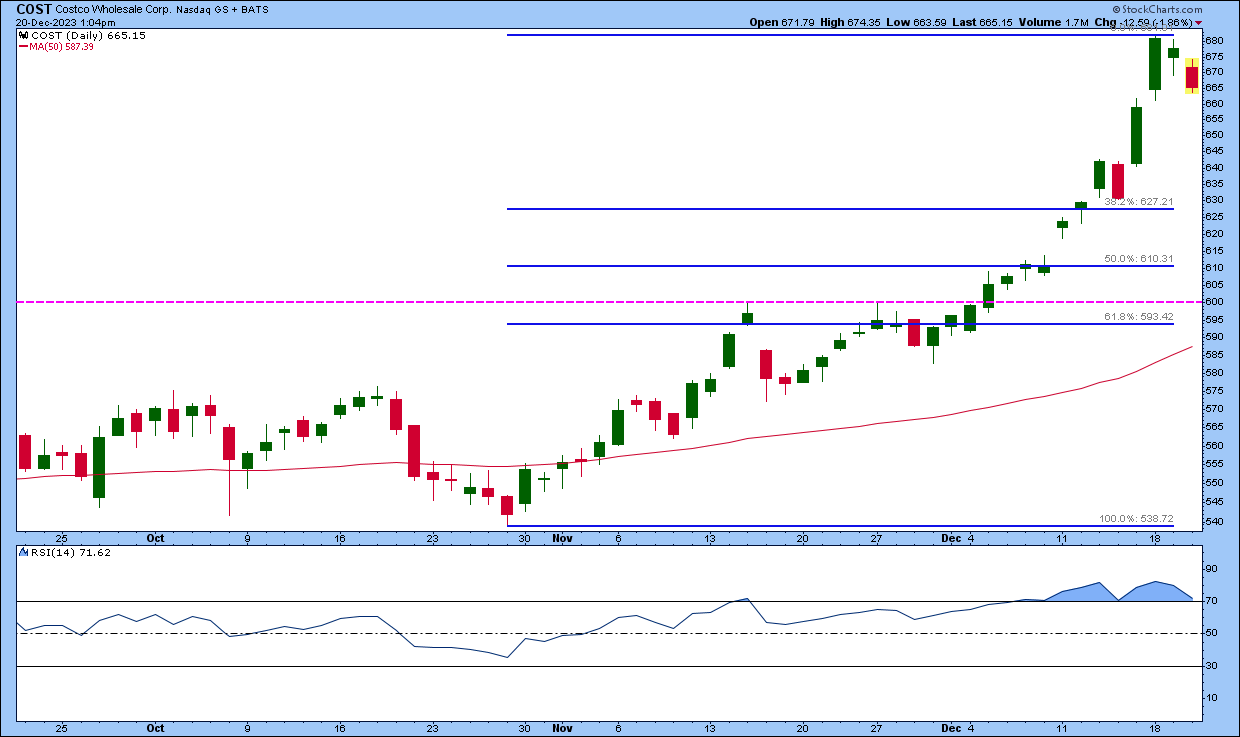
CHART 2: DAILY CHART OF COSTCO STOCK. Notice the scaffolding of several potential support levels. What's tricky is that market sentiment may be more fundamentally biased, possibly resulting in a quick touch-and-go scenario even at the slightest retracement.Chart source: StockCharts.com. For educational purposes.
Last Monday's candle saw COST hit an all-time high of 681.91, followed by an inside day. As the RSI reading indicates, it's well within overbought territory.
Today's session is threatening to take out Monday's low of 661.10, and this would be the pullback bulls looking to make a sharper tactical entry might be looking for.

A break below 661.10 would find the first level of support at 627.20, which is a 38.2% Fibonacci retracement level drawn from the November low to the most recent high. The 50% Fib retracement level at 610.30 will likely serve as another support area. Both constitute potential long entry opportunities.
But perhaps the strongest level of support will cluster around the range of 590 and 600 as it marks a convergence of three potential support levels—the previous all-time high of 603, which is now resistance-turned-support, the 61.8% Fib retracement level at roughly 593, and the rising 50-day SMA which should soon reach 590.
Buying a stock that has gone parabolic typically seems like a risky endeavor, as the market's gravity tends to strike heavily on exceedingly sharp ascents. However, the strength of COST's fundamentals may be enough to propel the stock higher once it takes a breather and settles into more reasonable, yet still impressive, valuations. If you're looking to enter a long position between COST's 50% and 38.2% FIb retracement levels, 590 may serve as a final stop-loss point as it sits right above the stronger support cluster.
That may seem like a wide stop loss, but, if you are bullish, your choice entry leaves you with a bit of a dilemma, as an early entry, which may be the smart way to go, means you have to assume greater market risk, while waiting for an ideal entry at the lower price ranges risks missing the entire trade should COST continue to move higher after a modest pullback.
Set a Technical Price Alert
Setting a technical alert at these Fib levels would be helpful as you weigh your potential entry points against any market developments that may influence your decision.
To access the Technical Alert Workbench, follow these steps:
- Log in to your account.
- At the top of any page, click on "Your Dashboard".
- From Your Dashboard, click the Alerts button or the "New" button in the Your Alerts panel.
- In the Alerts workbench, choose which type of alert you want to create from the "Alert Type" buttons at the top left. To create a price alert, select "Price Alert" as the alert type.
- Add COST in the symbol box and set your price trigger.
- Choose how you wish to be notified and then click the Save Alert button.
Disclaimer: This blog is for educational purposes only and should not be construed as financial advice. The ideas and strategies should never be used without first assessing your own personal and financial situation, or without consulting a financial professional.