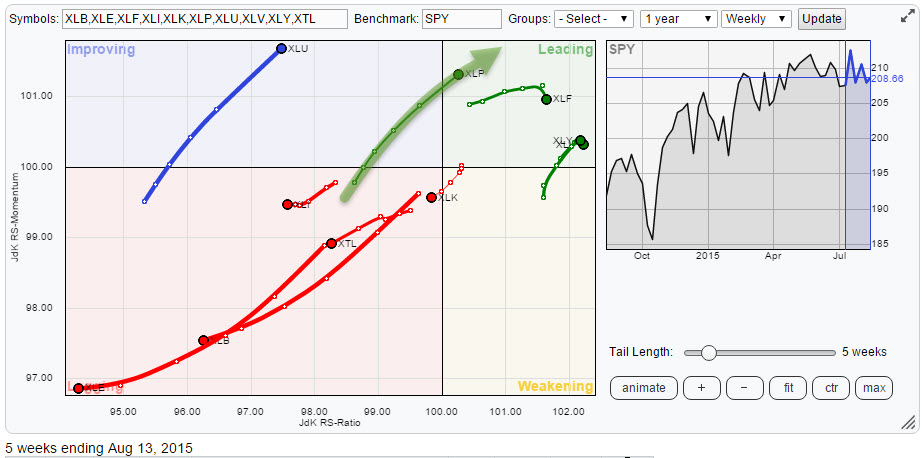
The top-level Relative Rotation Graph holding the nine S&P sectors clearly shows you which sector rotation is in play at the moment.
If I look at the rotation of the various sectors on this RRG chart, XLP, the Consumer Staples Sector, is catching my eye. The sector is in the improving quadrant heading higher on both the JdK RS-Ratio and the JdK RS-Momentum axes and very close to crossing over into the leading quadrant. Definitely worth a further study of XLP itself as well as the individual stocks that make up this sector to see if there are any outliers or interesting possibilities visible.
Consumer Staples - XLP
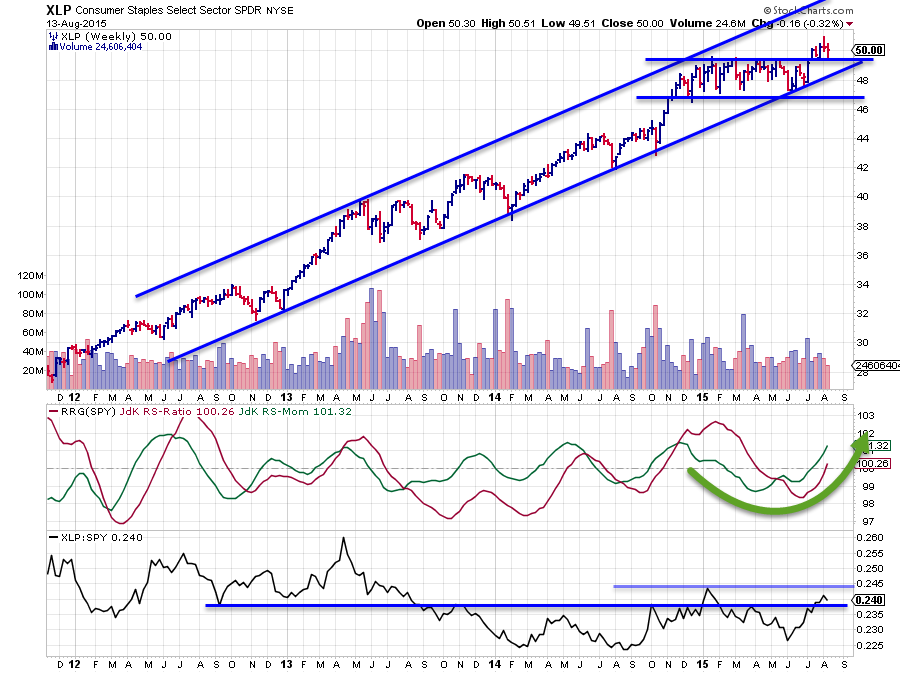
On the weekly bar chart XLP is still clearly within the boundaries of its rising long-term trend channel. The sector started to move sideways in the beginning of 2015 and ended up in a trading range between $ 47 - $ 49.50 until a few weeks ago. In the beginning of the year, when the sector peaked just shy of $ 50, XLP was probably judged as "overbought" by all traditional standards (RSI, MACD, etc.) and even showing some negative divergence. So, in hindsight, the stalling of the up-trend was no surprise. However the fact that this pause took the form of a sideways trading range instead of a corrective move down to the lower boundary of the rising channel, imho, should be seen as a sign of strength.
The overbought condition peaking against a rising resistance line should provide enough ingredients for a nice corrective leg down, within the boundaries of the channel. I.e. one would expect supply to take XLP down, most likely towards the $ 45 area where, in the beginning of the year the rising support line and the previous peaks were coinciding. The fact that such a correction did NOT materialize is a sign of strength. Apparently demand already kicked in near $47 and kept doing that ever since. This caused the sector to shrug off the overbought condition, get rid of negative divergences, etc. without clearly declining in price.
Recently the trading range hit the area where the rising support line started to come in as its level moved up $2-3 since the beginning of the year and the last two lows in price were set against this rising support line. After setting these lows, the most recent rally managed to break above the upper boundary of the trading range, suggesting that supply which had kept XLP down over the past months has gone now. This situation now opens up the way for a further rise within its long-term channel.
From a relative perspective the sideways move caused relative strength to decline. The JdK RS-Momentum dropped below 100 already in February, followed by the JdK RS-Ratio line in early April. The improvement in price is now starting to affect the relative picture as well. RS-Momentum is already back above 100 while RS-Ratio is heading higher fast. This puts XLP inside the improving quadrant on the Relative Rotation graph and close to crossing over into the leading quadrant. This suggests a positive sector rotation for Consumer Staples in coming weeks/months.
Now, with the sector improving as a whole let's see if we can determine which stocks have caused the initial improvement and, more important, if they are likely to continue or if rotation into other members of the sector is (more) likely?
In order to do this I am going to look at an RRG which holds all the members of the XLP index. Please refer to this post to find out how you can do that.
Dissecting XLP
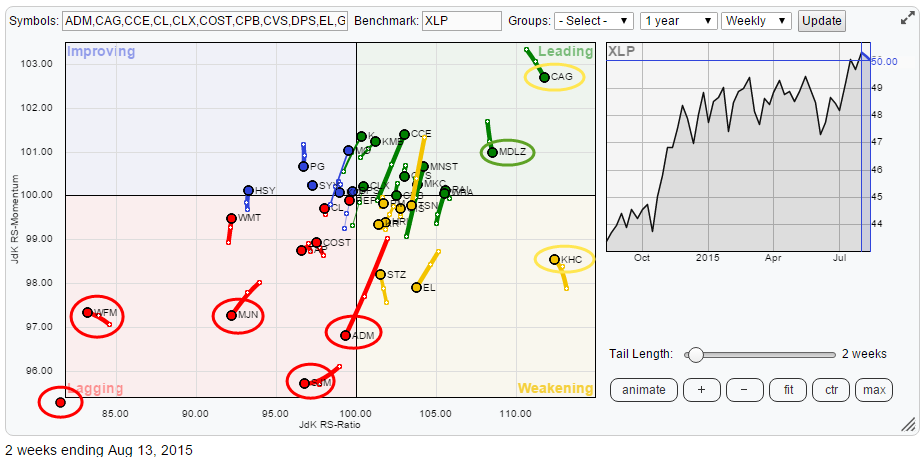
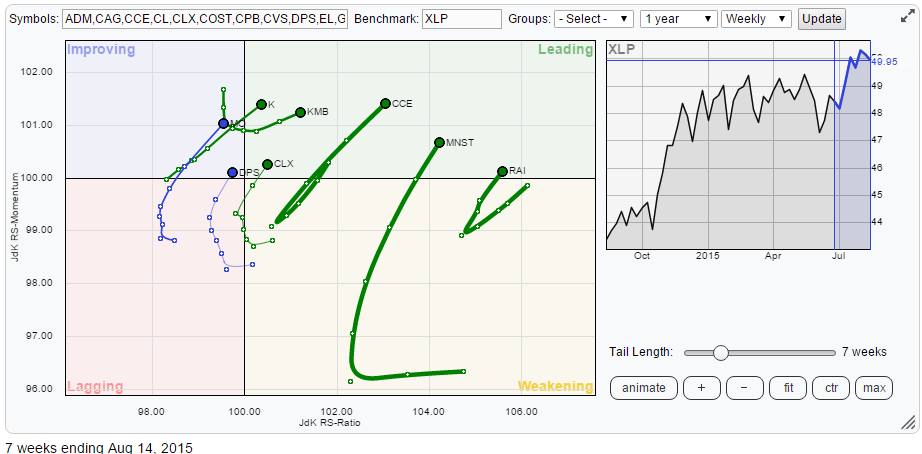
The above Relative Rotation Graph shows the rotation of individual stocks inside the Consumer Staples sector. While doing a quick first scan of this graph there are a few names that immediately catch my eye and which I would like to investigate further. Remember that the sector as a whole just entered the leading quadrant on the RRG. So what we are looking at are stocks which in general should show a relative up-trend against the S&P 500. Hence if we take a 'long-only' view and agree that the Consumer Staples sector is likely to continue its relative up-trend vis-a-vis the S&P 500 we are looking for stocks which will then also show an up-trend against XLP and are thus likely to even do better than XLP.
The negatives
However there are also some, very, clear negatives... If we start with those first I am talking about the stocks inside the lagging quadrant marked with a red circle. The one in the bottom left corner is GMCR which is so far away from the centre that it is distorting the overall picture. The other names are WFM, SJM, MJN and ADM.
GMCR is absolutely nose diving and has been doing that since December last year - definitely an under-performer and a relative down-trend which is very likely to continue a little longer.
WFM is deep inside the lagging quadrant for a reason as well, as you can see on the chart below
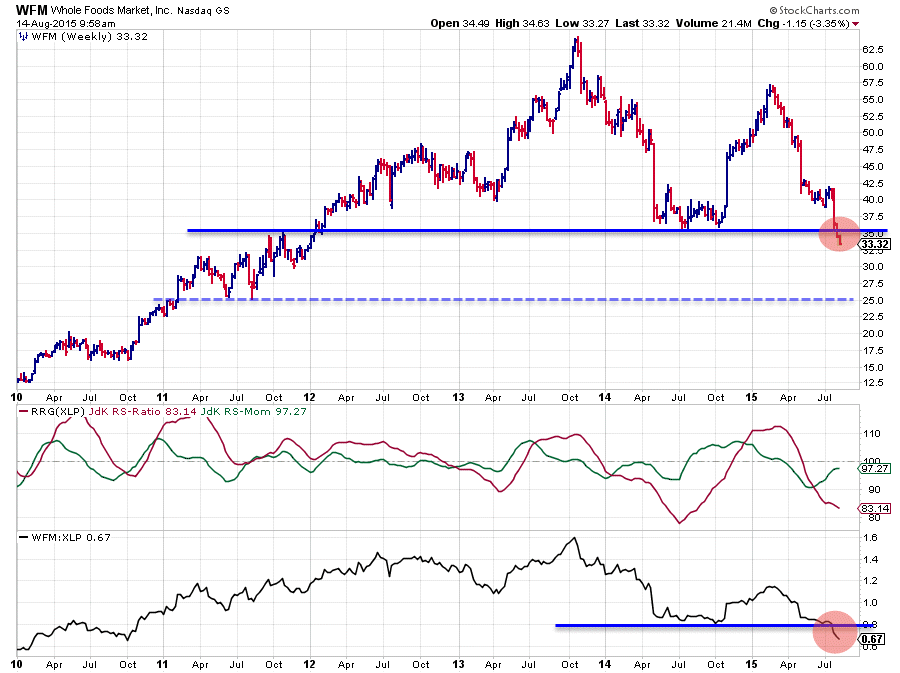
On the price chart this stock just broke a massive support level near $ 35 downward and immediately started accelerating. From a price perspective the first meaningful support level is only found around $ 25, roughly 20% lower but more importantly the former support level will now start to act as resistance and limit any upside potential for quite some time I expect.
All this negative price power does not bode well for relative strength. As you can see in the raw RS-line a major support level has just been broken downward here as well. The JdK RS-Ratio line had already dropped below 100 a few weeks earlier and the hiccup in the JdK RS-Momentum line already seems to be coming to an end. Very little opportunity for upside on both the price and the relative charts can be seen here.
SJM and MJN are showing weak charts as well, with MJN probably a bit more at risk than SJM.
ADM, however is showing an interesting picture as it just broke below its rising support line but is now holding up at horizontal support coming off the previous low around $ 45.
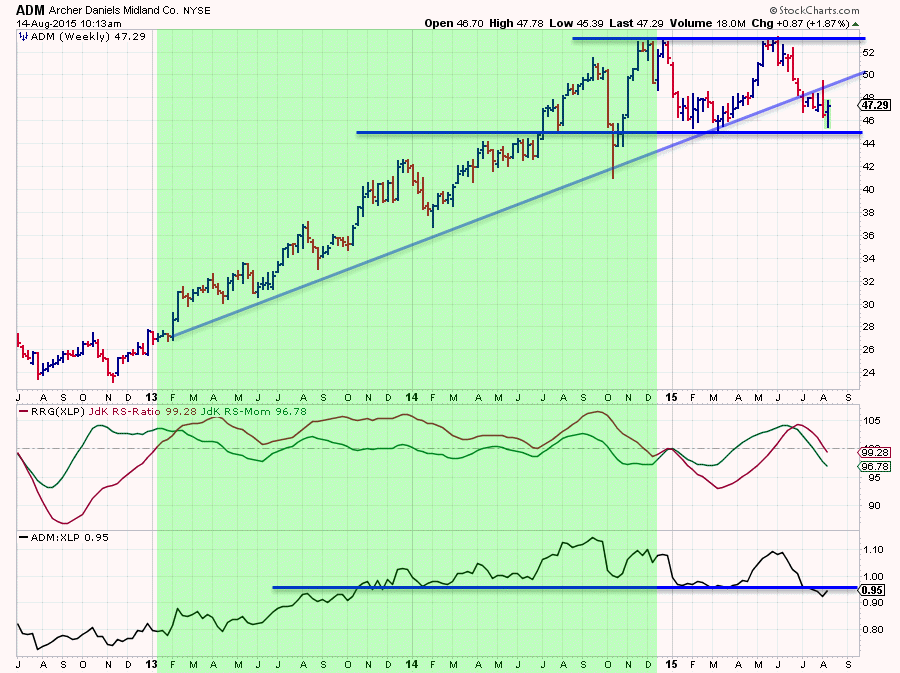
The biggest question here is if this horizontal support level will be able to hold up and keep ADM inside a trading range. In case $ 45 is taken out downward a further drop is likely. The relative picture is starting to weaken against its XLP benchmark. Relative momentum is pointing down and dragging the RS-Ratio line lower. The break in the raw RS-line is not convincing (yet) and this situation could drag on for a few weeks before we get any real clarity about future direction. At the moment the risk is judged to be on the downside (break below $ 45 followed by an acceleration) while relative strength does not suggest any upside potential for the time being.
Mature relative up-trends but potentially over stretched
In the leading quadrant I marked three symbols for further inspection. These are CAG, MDLZ and KHC. CAG and MDLZ are inside the leading quadrant but heading lower on the JdK RS-Momentum axis while KHC is inside the weakening quadrant and moving higher on the RS-Momentum axis.
When you scroll the RRG above back you will be able to see that CAG crossed over into the leading quadrant in the week of May 1st. Since then this stock has gained over 20% against 3% for the sector (XLP) - clearly one of the drivers for the improvement of XLP against other sectors in the past weeks. It is still comfortably inside the lagging quadrant which means that the relative trend is still clearly up. Unfortunately this also means that downside risks are increasing as a lot more buying power is needed to keep this trend going. Trend following dictates that we stick with it for now but I would not see this as a new opportunity.
MDLZ and KHC are similar cases. Crossed into the leading quadrant mid-May and late March and gained 15% and nearly 60% since (2% and 6% for XLP in the comparable period). These are still solid and mature up-trends against XLP but probably not the time to buy into new positions now.
Fresh potential
When there are a lot of symbols on the RRG chart the 'controls' that StockCharts provides come in handy as you can scroll back and forth, zoom in and out, select and deselect, to get a grip on the rotation inside the sector. While doing that I identified a number of ticker symbols which could offer renewed upside potential and therefore deserve a better look. In the Relative Rotation Graph below I only selected these stocks in order to get a clearer view of their rotation.
When there a multiple possibilities to choose from as appears to be the case here, I like to look for potential or confirmed breakouts on the price charts. The relatives are good already otherwise they would never have showed up on the RRG where they did :)
From this sub-set there are a few names that are showing nice breaks and could offer more upside potential in the weeks to come.
K- Kellogg
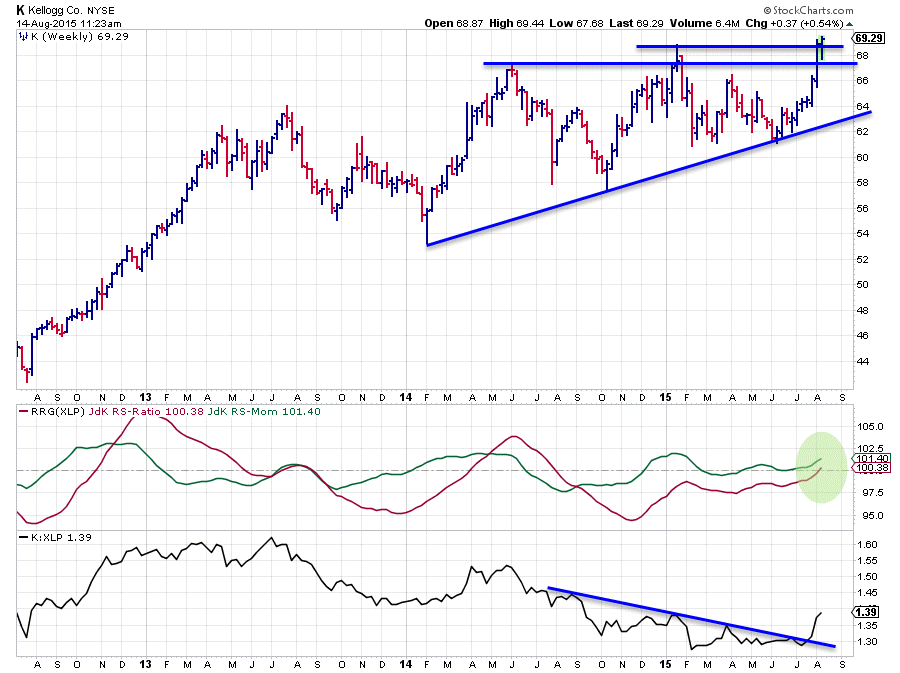
K is one of the stocks that is just breaking out above an important horizontal resistance level while relative strength is turning positive after having been in a down-trend for quite a while. As you can see in the above chart the JdK RS-Ratio line dropped below 100 mid 2014 and a falling resistance line kept the raw-RS line down during the same period. Recently relative strength started to improve and last week price managed to jump above $ 67 and this week that break is holding up and taking out the level of the last peak at $ 68.80.
What I like here is that both price and relative are turning upward at the same time. As K was an under-performer within XLP, unlike some of the other names mentioned and shown above, this means that it could become one of the leading stocks driving XLP deeper into the leading quadrant.
DPS - Dr Pepper Snapple Group
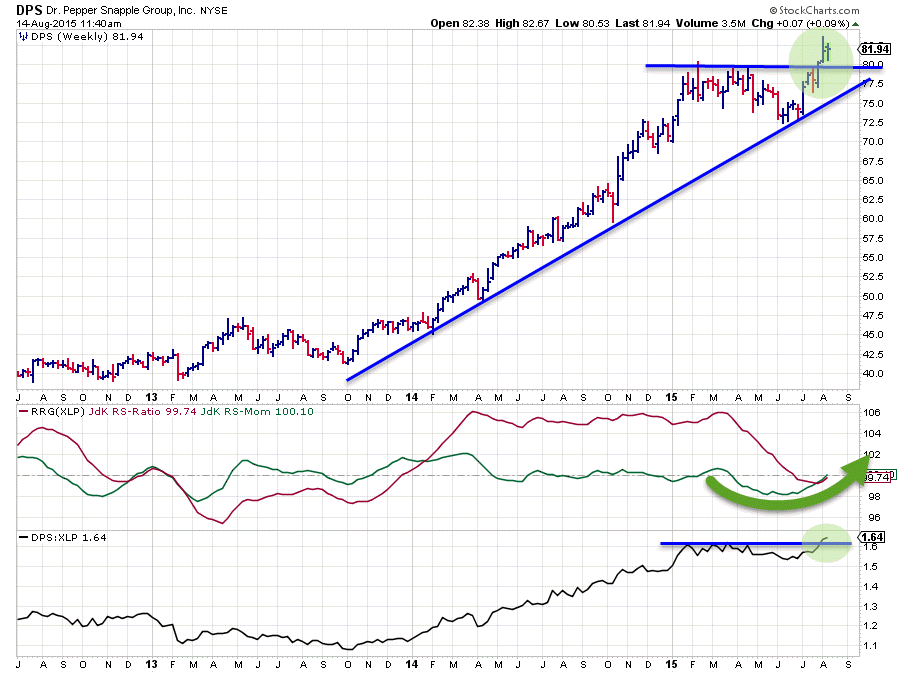
Another stock that fulfills these criteria is DPS. On the price chart the stock is still in a very strong up-trend and recently managed to break an important resistance level around $ 80 which was built up in the beginning of this year. So far the break is holding up well which suggests that more upside potential is around the corner.
On the relative charts DPS showed a strong up-trend against XLP since the beginning of 2014 but started to move more or less sideways in the beginning of this year (2015). This sideways move in the raw RS-line brought the JdK RS-Ratio back down to levels around and just below 100, taking away the over-stretched situation which was present previously.
With the RS-Line breaking above its previous highs and the RRG-Lines both turning higher in combination with a breakout on the price chart things now look good for DPS. And just like Kellogg, Dr Pepper could well be one of the stocks taking over the lead from CAG, KHC and MDLZ and push XLP higher in relation to the other sectors in the S&P 500.
Conclusion
- Consumer Staples - XLP pushing into the leading quadrant
- GMCR, WFM, SJM, MJN, ADM all inside lagging quadrant and expected to continue their relative down-trend versus XLP
- CAG, KHC and MDLZ in strong, mature, relative up-trends and still looking good but probably too far stretched for new positions
- K, KMB, CCE, MNST, RAI, CLX, DPS and MO all showing nice improvements for further improvement of their relative strength against XLP
- K and DPS both breaking out above resistance while relative strength is turning higher
Julius de Kempenaer | RRG Research
RRG, Relative Rotation Graphs, JdK RS-Ratio and JdK RS_Momentum are registered TradeMarks by RRG Research