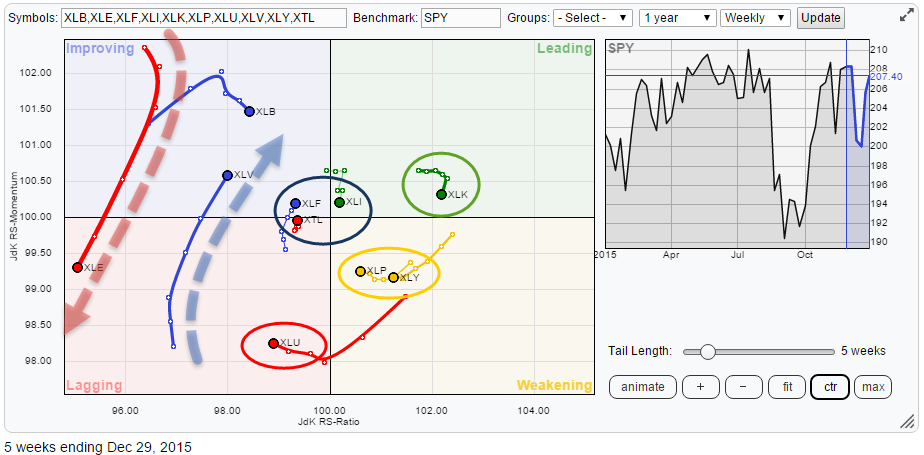
The Relative Rotation Graph for US sectors is once again showing us some interesting rotational patterns at the moment. Clearly XLE is showing us a very long tail moving from improving back to lagging again. Then there are XLU, XLV and XLB also showing long tails but sending different messages. XLK is pretty lonely inside the leading quadrant but holding up well there.
XLP and XLY are an interesting pair to look at from a rotational point of view. They are expected to move more or less opposite of each other, and they usually do, but not at the moment...
Around the center of the chart XLF, XTL and XLI are hovering close to the benchmark with very short tails.
Summary
- Energy (XLE) resumes its strong relative downtrend
- Materials (XLB) starting to lose relative momentum again
- Health Care (XLV) on the way back?
- Utilities (XLU) entering lagging quadrant
- (Technology (XLK) showing strongest relative trend)
- Staples (XLP) and Discretionary (XLY) moving in tandem
Quick scan
A first quick glance over the Relative Rotation Graph immediately reveals the long tails for XLE and XLV and to a lesser extend for XLB and XLU. XLE is showing the strongest rotation as it is rotating back into the lagging quadrant from a temporary move through improving. Given the length of the tail and the angle of the rotation more relative downside should be expected for this sector.
XLV, on the other hand, is rotating from lagging into improving and is doing so while showing a long tail, indicating that there is good relative momentum behind the move. The question is whether this momentum will be strong enough to carry the Health Care sector all the way up to the leading quadrant.
In the lower half of the RRG, we find XLU entering the lagging quadrant a few weeks ago. But almost immediately after crossing over, the sector started to, slightly, pick up.
On the right-hand side of the graph we find the Technology sector, still, inside the leading quadrant with a relatively short tail indicating that this relative trend is stable for now. Also on the right-hand side of the chart but inside the weakening quadrant are Consumer Staples and Consumer Discretionary showing a similar rotational pattern over the past few months which is unusual.
Energy - XLE
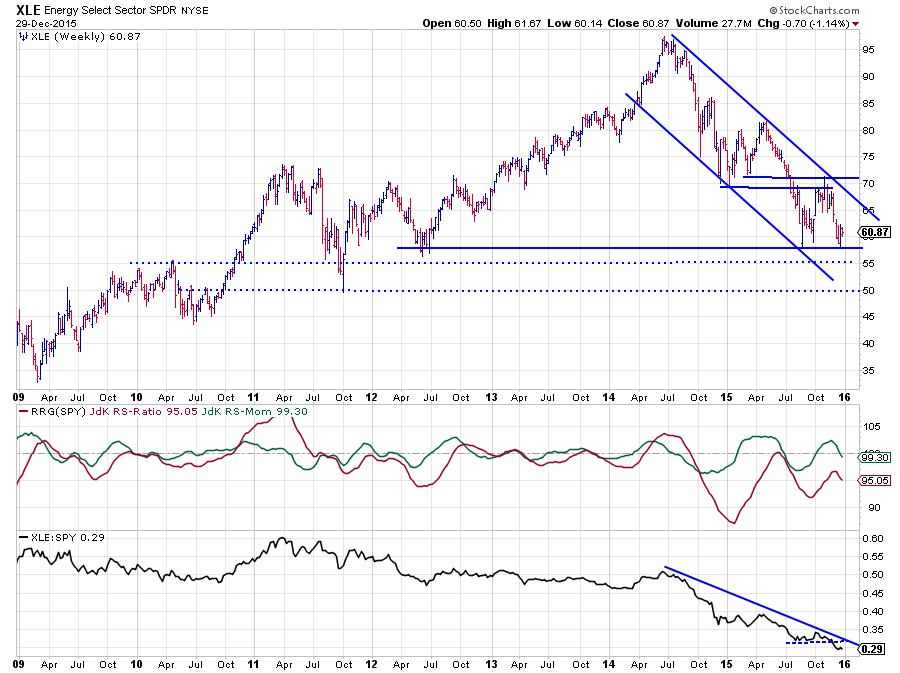
Over the past few weeks, XLE dropped back to the support area near $ 57.50 after having set a new, lower, high around $ 70. This implies that the downtrend on the price chart is still fully intact and also that this sector is now seriously at risk for another break lower (< $ 57.50). When that happens, another acceleration down may be expected. On the chart above I have drawn two dotted lines on levels where new support may be expected in case $ 57.50 gives way. However, as you can see, these levels are coming off previous highs and lows that are already a few years old and not very pronounced, i.e. less reliable.
From a relative point of view, things look even worse as the downtrend in the raw RS line is still very much intact but recently broke below its recent lows that were set in August-September. The level of the JdKRS-Ratio makes Energy the sector with the weakest relative trend in this universe at the moment.
All in all a further decline in relative strength versus the S&P 500 index is likely in coming weeks.
Materials - XLB
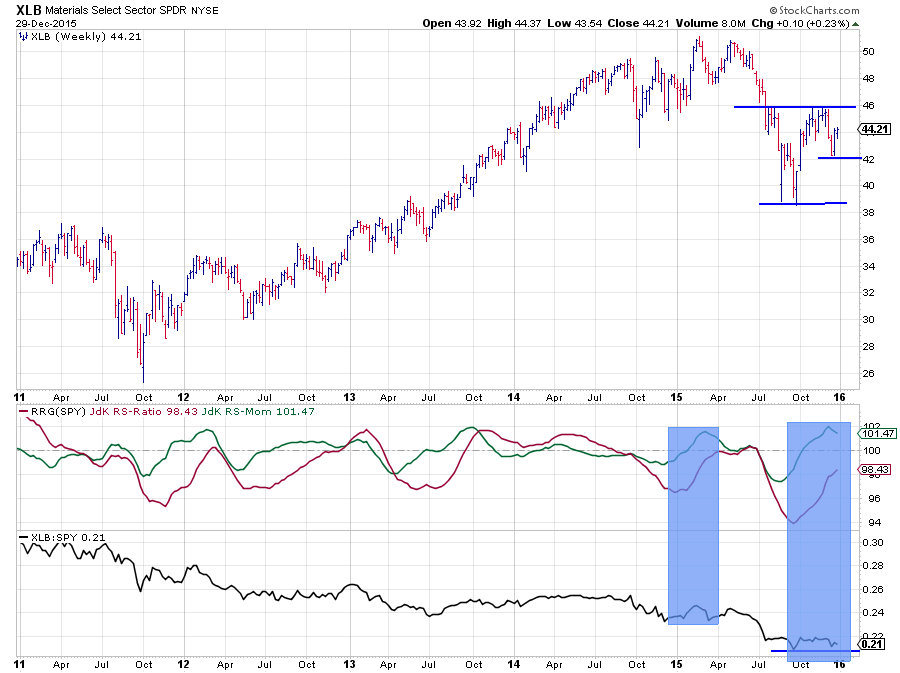
Measured on the JdK RS-Ratio scale, Materials is now the third weakest sector in the universe. Based on the JdK RS-Momentum scale, however, it is the strongest sector. This creates a bit of a mixed picture that requires some more investigation. On the Relative Rotation Graph, a loss of relative momentum can be seen over the past few weeks. As this loss of momentum is taking place with the sector positioned inside the improving quadrant at high RS-Momentum levels but low RS-Ratio levels it is doubtful whether the sector will be able to continue the recent positive rotation all the way into the leading quadrant. In strong relative (down) trends, a rotation often occurs completely on one side (left in this case) of the RRG.
The positioning on the RRG comes from the RRG-Lines in the chart above, and it is pretty similar to the situation seen at the beginning of the year. Both the blue shaded areas are preceded by a downtrend in relative strength; the RS-Ratio indicated these downtrends by moving lower and then came to rest when the raw RS-Line started to moving flat, causing RS-Momentum to go up and eventually drag RS-Ratio higher as well.
In the first instance, RS-Ratio came from a level just above 96 and managed to just cross above 100 before dropping back. Note that the JdK RS-Momentum line had already started to fade at that time. The current recovery of relative strength is coming from a much lower level on the RS-Rato scale, and RS-Momentum has already begun to level off and move down a little.
From a relative point of view, this is not a strong picture and a rotation lower and back down to the lagging quadrant still looks very likely. A break below the most recent low in the raw RS-Line will definitely add more fuel to the relative downtrend.
The price chart is showing a slightly different picture as the most recent low has been formed at $ 42 which is clearly higher than the previous one near $ 39 and the price seems underway to challenge overhead resistance around $ 46.
We will have to wait and see how this pans out and if a further improvement on the price chart will be able to turn around the current weakness in relative strength. A break below the indicated support levels on the price chart, on the other hand, will very likely add to the downtrend in relative strength.
Health Care - XLV
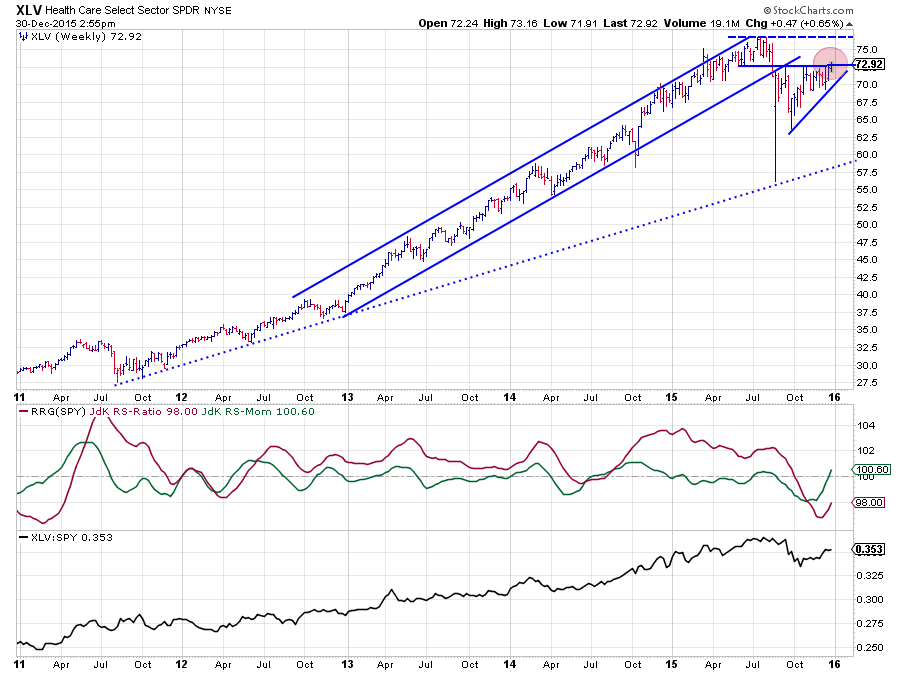
Also inside the improving quadrant on the Relative Rotation Graph, but rotating at a different angle is the Health Care sector. The XLV chart, in combination with the RRG-Lines and relative strength, was characterized by a fantastic rally in both price as well as relative strength since the beginning of 2012. Except a short period in 2014 the JdK RS-Ratio has moved comfortably above the 100 level, tracking the uptrend in relative strength. This situation ended in August when price broke down first, rapidly followed by relative strength.
These breaks did not get a real follow through. On the price chart, an ascending triangle started to take shape while the raw RS-Line moved flat to slightly higher after the initial drop. At the moment, price is pushing against the horizontal resistance level (between $73-74) that marks the top of this formation. A break beyond this barrier will certainly mean an improvement for XLV but the next resistance level after that is already found near $ 77 which means that there is, still, limited upside potential.
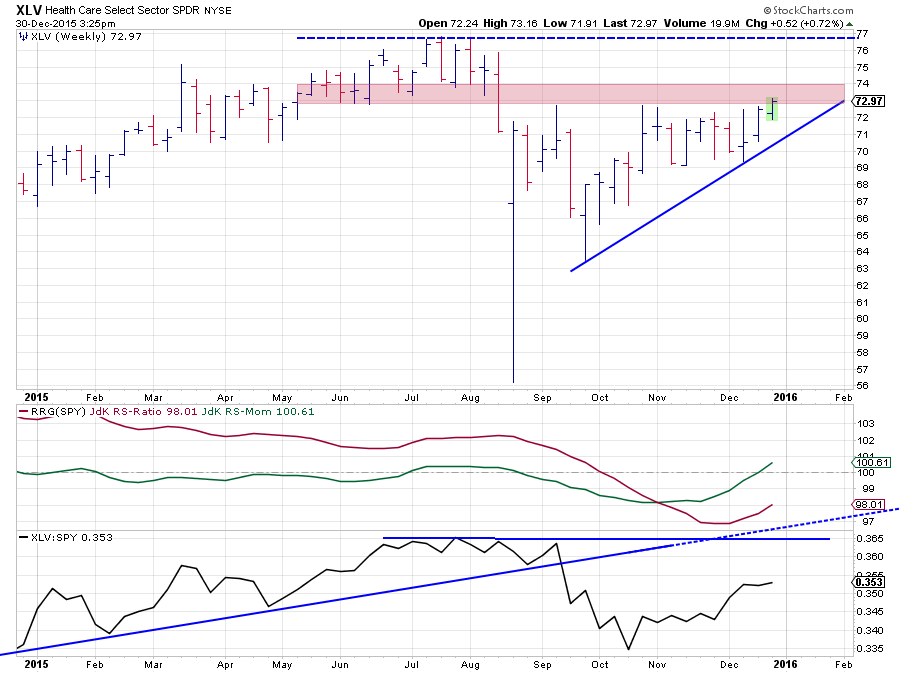 A somewhat similar situation is found in the chart of the raw RS-line. After the break below the rising trendline, relative strength formed a low in October, and we currently see a move higher out of that low but it is by no means a new uptrend (yet). And it is very well possible that the current movement is a recovery rally after the first leg down in RS.
On the small (zoomed in) chart, you can see that the old rising support line and the level of the previous high will be coming back as resistance levels in the near future in case of a further rise in RS.
Despite the (short-term) improvement, the situation for XLV is not very positive yet and a rotation down, back to the lagging quadrant, is a very serious possibility for this sector.
Utilities - XLU
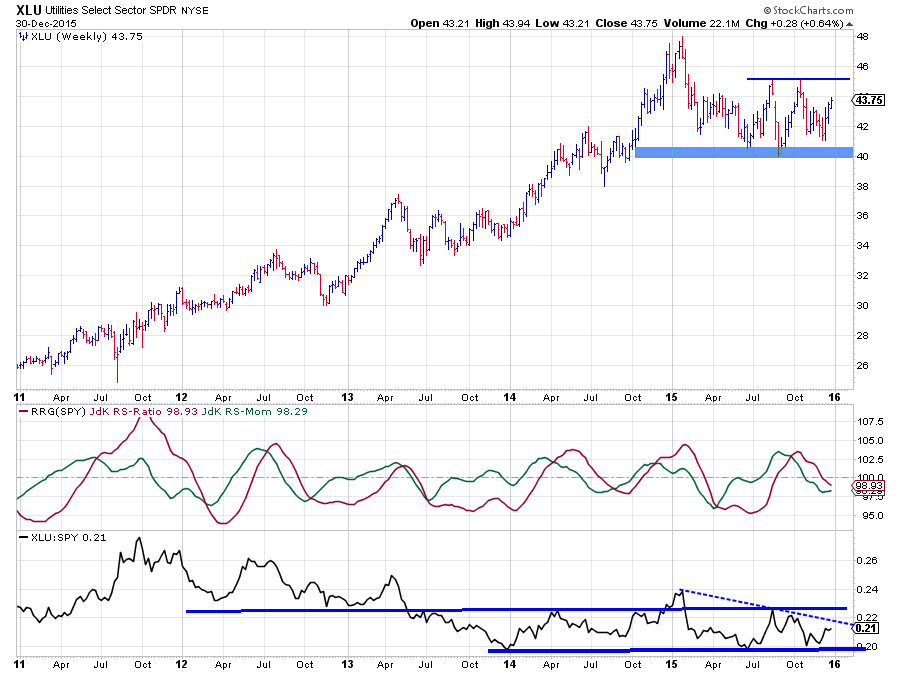
After reaching an initial high at the beginning of the year, the utilities sector started trading within the boundaries of a trading range between $ 40 - 45. With the sector currently trading in the middle of that range, there are no real clues pointing to a possible breakout on either side.
The relative strength picture is mixed. The raw RS-Line looks to be moving in a range between two horizontal boundaries, slightly trending down if we take the dotted resistance line into account.
On the Relative Rotation Graph, the Utilities sector is the one with the lowest JdK RS-Momentum value. Although it has been very slowly moving higher over the past few weeks.
This still makes Utilities one of the weaker sectors from a relative point of view especially as it is moving lower on the JdK RS-Ratio scale.
Consumer- Staples / Discretionary rotation
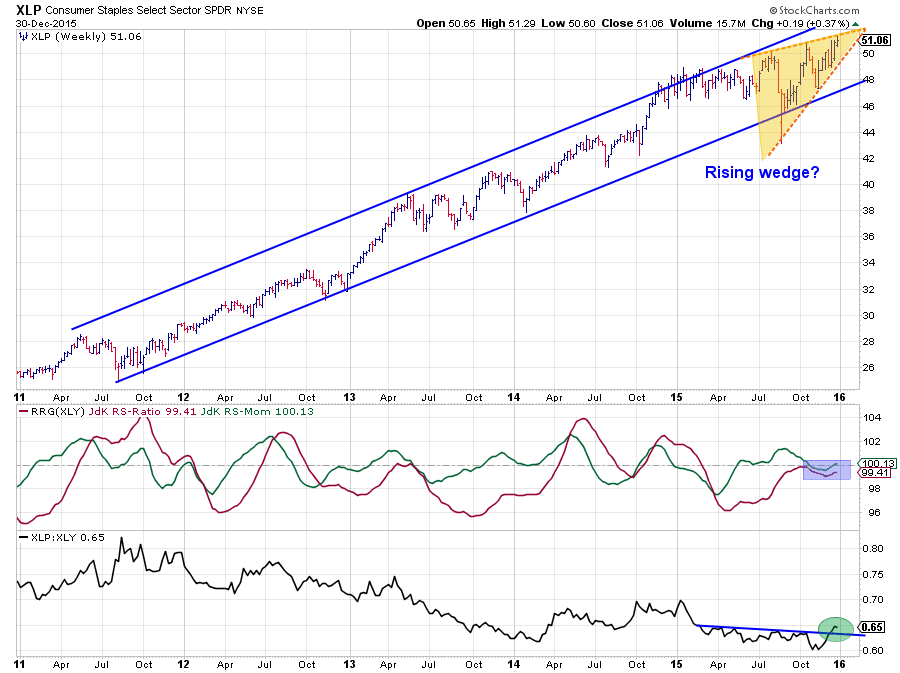
The chart above shows the weekly bar (price-) chart for the Consumer Staples sector (XLP) and the RRG-Lines and raw RS-Line against Consumer Discretionary (XLY). Quite frankly, this picture is sending mixed signals.
On the price chart everything is looking good .... or maybe not? The uptrend, which really already started back at the beginning of 2009 is still fully intact putting in higher highs followed by higher lows. However, what bothers me, a bit is the potential rising wedge pattern that could be unfolding over the past few months. As you probably know, such a rising wedge is a trend-ending reversal pattern and given the long run-up that XLP went through it would be an ideal location on the chart for a wedge to be formed. It is still early, but I have drawn in the pattern and will keep an eye on it as the implications in case of a downward breakout will very likely be significant.
The relative strength pictures for both sectors against the S&P 500 (SPY) usually are, more or less, each others opposite. The snapshot from August 2014 of the RRG below shows this pretty well. If you click the chart, you can open the live version and see the animation of the Staples / Discretionary rotation through time.
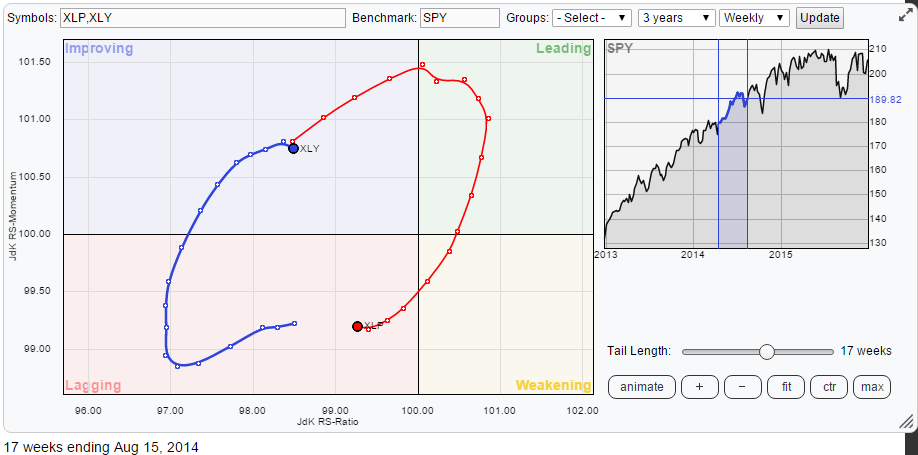
At the end of the rotation, note how the two tails are starting to move in sync, Indicating a more or less identical relative trend against the benchmark. This is the result of the JdK RS-Ratio and RS-Momentum lines moving in the same direction (lower) over the past few weeks. Things are better seen in the two, zoomed in, charts below.
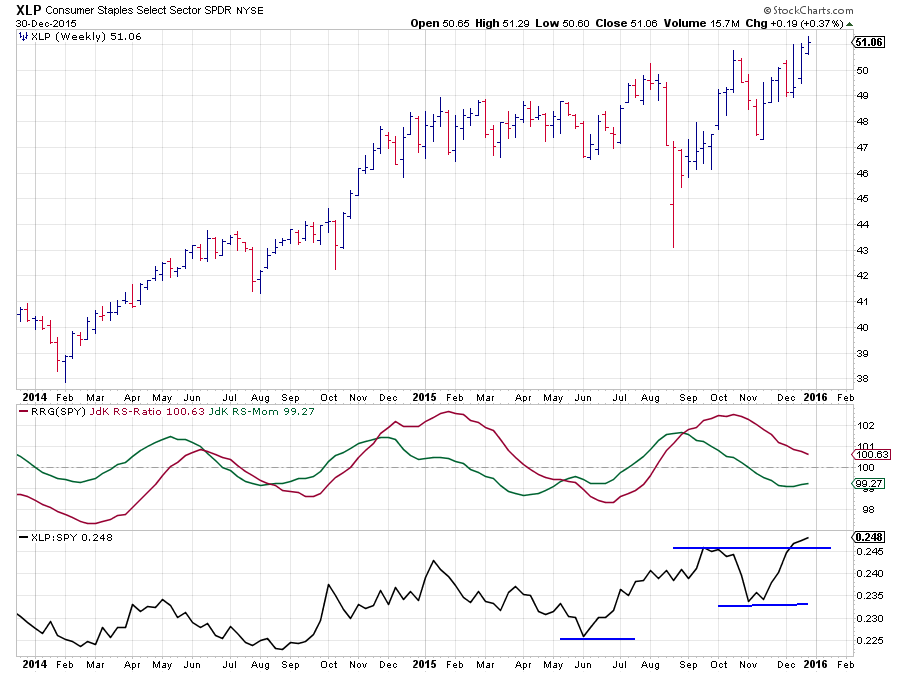
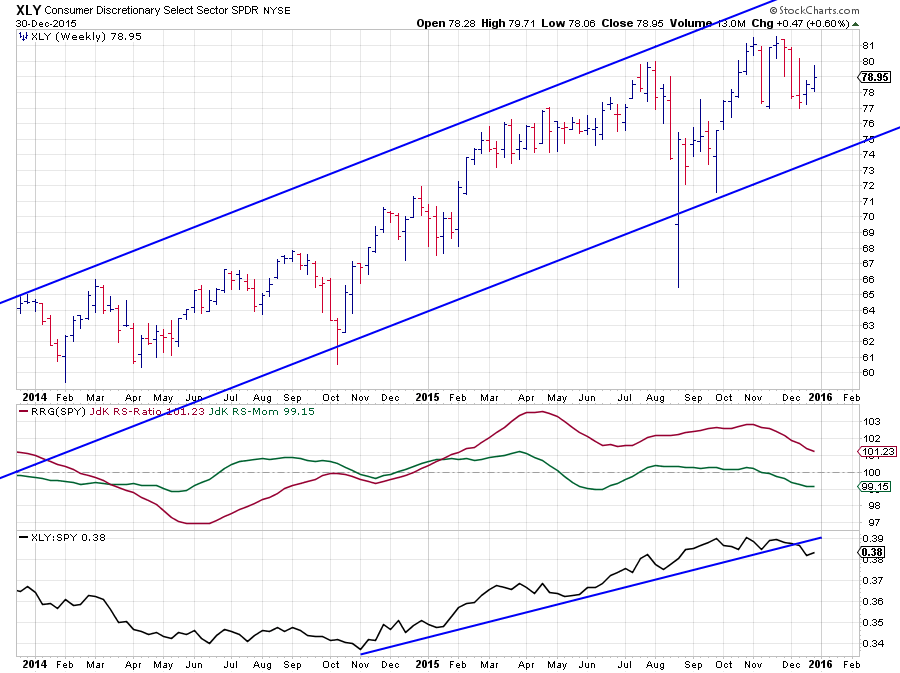
Despite the RRG-Lines moving in tandem, the underlying relative strength line is probably giving a better clue here. RS for XLP is showing the careful, start of a new uptrend developing with a recent break above its previous high. Relative strength for XLY, on the other hand, seems to be rolling over after a run-up of relative strength since late 2014.
On the XLP/XLY comparison above this results in an upward break of the XLP/XLY ratio that is an early signal for a trend reversal potentially being around the corner. The RRG-Lines have not picked up this subtle change of direction yet (they are trend-following in nature hence lagging) but will do as soon as the moves continue.
This implies an improvement of XLP over XLY with Consumer Staples becoming the preferred sector and that is where the mixed signals are coming in as it is hard to understand that XLP will be the better sector if that rising wedge pattern will actually be completed, sending price lower. I'm afraid that we will have to wait until the new year before the market will give us any answers.
With my background and preference for relative strength based analysis, I have seen many situations where relative strength actually led developments in price so my "guesstimate" is that relative strength will also dominate here, meaning that Staples will be taking over from Discretionary in coming months.
Happy New Year
As it is the last day of 2015 already I would like to wish all of you a very happy new year with a lot of positive returns. I hope you have enjoyed my contributions, I know I enjoyed writing them and I am looking forward to share my thoughts with you again in 2016. As usual please do not hesitate to drop any questions or comments in Disqus.
Julius de Kempenaer | RRG research
RRG, Relative Rotation Graphs, JdK RS-Ratio and JdK RS-Momentum are registered TradeMarks by RRG research.