
Monitoring purposes SPX; Sold 9/30/14 at 1972.29= gain .003%; Long SPX on 9/25/14 at 1965.99.
Monitoring purposes Gold: Gold ETF GLD long at 173.59 on 9/21/11.
Long Term Trend monitor purposes: Flat
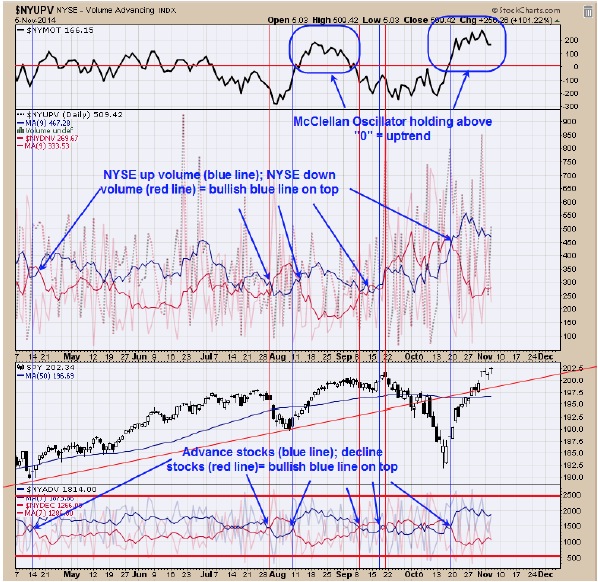
This chart looks at the internals for the market to determine they are in bullish or bearish mode. The top window is the McClellan Oscillator and readings above “0” indicate a bullish condition of which it is. Next window down is the NYSE up volume with 9 period moving average (blue line) and NYSE down volume (red line) with 9 period moving average. When the blue line is above the red line, than up volume is exceeding down volume and a bullish condition for the market (currently blue line above red line and bullish). Bottom window is the NYSE advancing stocks (blue line) with 7 period moving average and NYSE declining stocks (red line) with 7 period moving average. When the Blue line is on top than advancing stocks are out pacing declining stocks and a bullish condition which is what we have now. For the momentum the short term internals are still bullish.
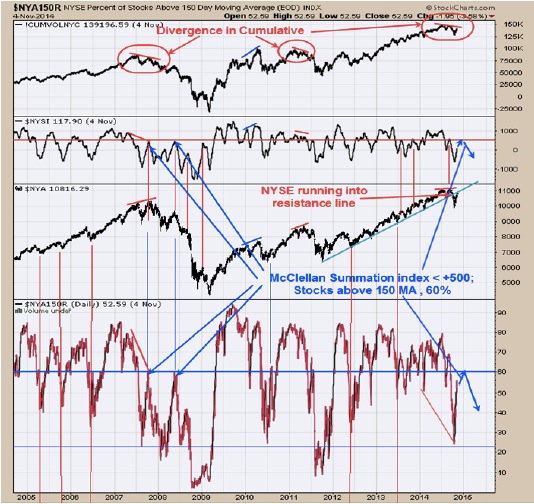
As mentioned on previous reports we are expecting a trading range over the next several weeks in that the McClellan oscillator reached the +250 range (exhaustion move up) and our TICK/TRIN ratio reached below -100 (suggests sideways market for several weeks). When and if market pull back does come, we will be watching the McClellan Oscillator and stocks above their 150 day moving average closely. If the McClellan Oscillator turns down near +500 and the Stocks above their 150 day moving average tops near 60% than signs for a topping market are present. If however, the market pull back is mild and the next rally up pushes the McClellan Oscillator above +500 and the Stocks above 150 day moving average exceed 60% than the bulls are still in control. The top window is the Cumulative volume indicator which is showing a divergence similar to the 2011 and 2007 tops. Also notice that the NYSE is running into the resistance line connecting the low going back to the 2011 low. Our thinking is that the market does pull back near current levels (possible 50% retracement to 192 on the SPY) and rallies again to match the current highs creating a trading range and the McClellan Oscillator stays below +500 and the Stocks above 150 day moving average stays below 60%. At least that is our thinking for now, it may change as the data changes. We are staying neutral for now.
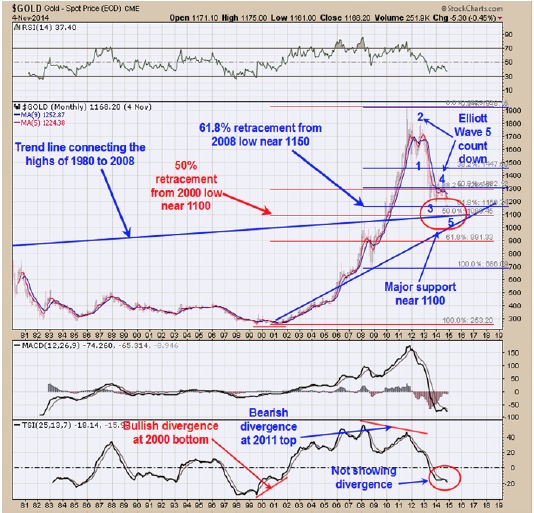
Sentiment readings in general for gold are at bullish levels and suggests gold is near a low; however momentum needs to turn up before a low can be stated. The chart above is the monthly chart for gold going back to 1980. A 50% retracement of the rally from the 2000 low in gold comes in near 1100 and a 61.8% retracement of the rally form the 2008 low comes in near 1150 and a trend line support connecting the highs of 1980 to the high in 2008 comes in near 1100 and an ideal place to look for a bottom. Gold appears to be in final Wave 5 of an Elliott wave five count down from the 2011 top and the area from 1150 to 1100 could finish wave 5. The bottom window is the “True Strength index” (TSI) which at the major bottom of 2000 and major top at 2011 produce major divergences. In the current time frame TSI is not showing a divergence. The 1150 to 1100 area for gold is a likely target for a low and gold reached 1143.42 today. So far we are not receiving evidence that today’s low is the final low.
Tim Ord,
Editor
www.ord-oracle.com