The markets have been trading mostly sideways over the last six weeks as investor’s initial election-induced exuberance has given way to apprehension about what a Trump election will really mean for the economy. Let’s use a recent post-election surprise rally and then sell-off as a guide for what to look for when a sideways move turns negative.
Below is a chart of the S&P 500 which is currently exhibiting trading action that has a strong resemblance to the sideways move that followed the surprise Brexit vote rally. As you can see, the sideways move then resulted in a breakdown that we can use as a guide for what to be on alert for now.
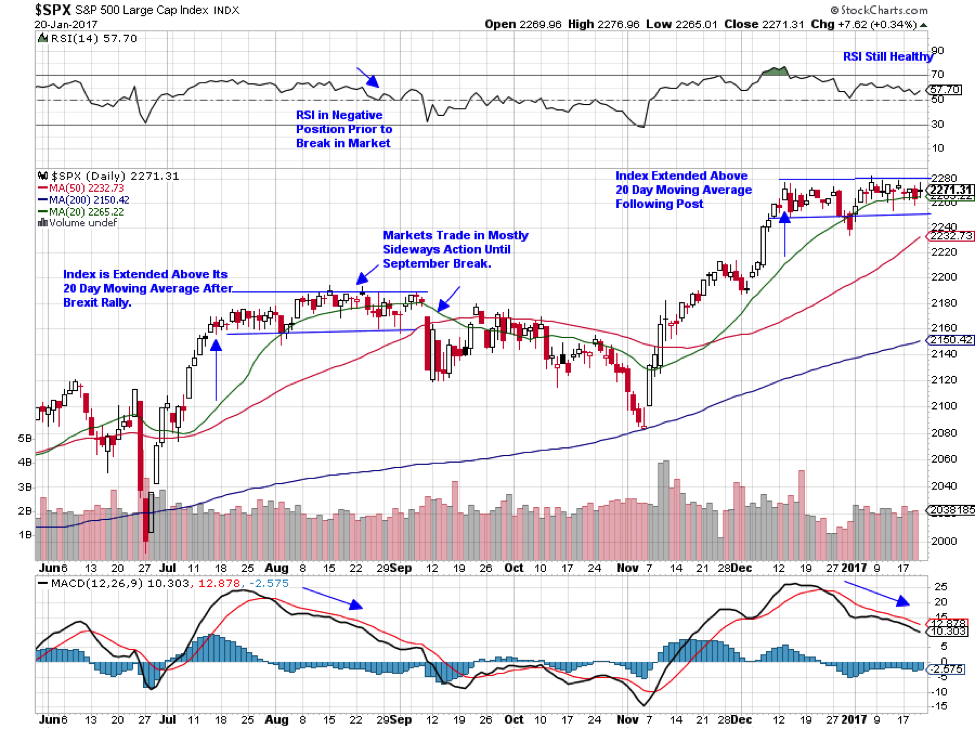
At this time, the current sideways move in the S&P 500 remains healthy as the price is retaining a presence above its 20 day moving average. The first sign of trouble would be several days of trade below this level which in turn would drag down the slope of this moving average. As you can see from September, the 20 day crossing below the 50 day moving average (known as the death cross) was the beginning of a 3.6% slide in the S&P 500 with many individual stocks getting hit harder.
The RSI can be another indicator to pay attention to as this is also still in a somewhat positive zone. We would look for a more pronounced downtrend and then of course an eventual break below the net zero line to signal a selloff.
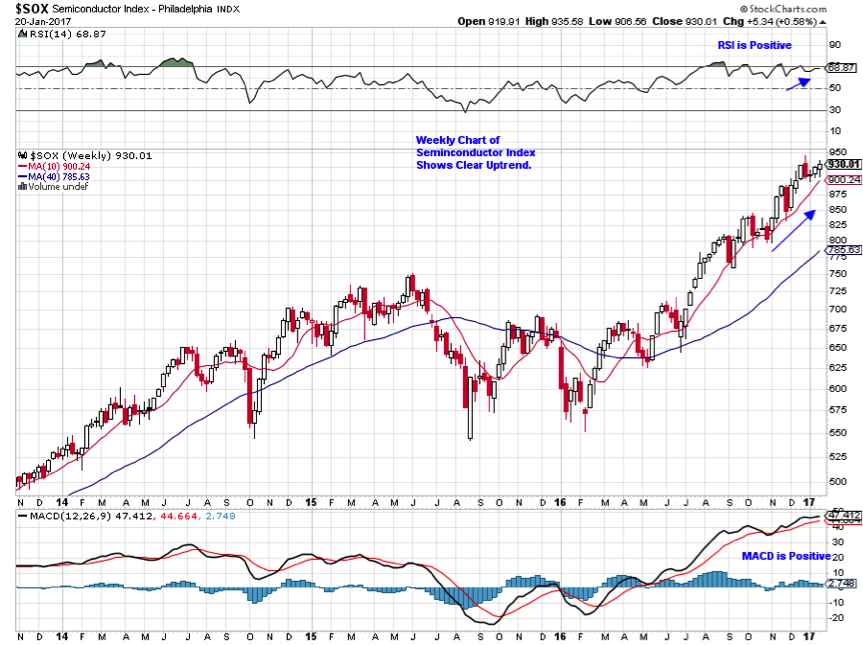
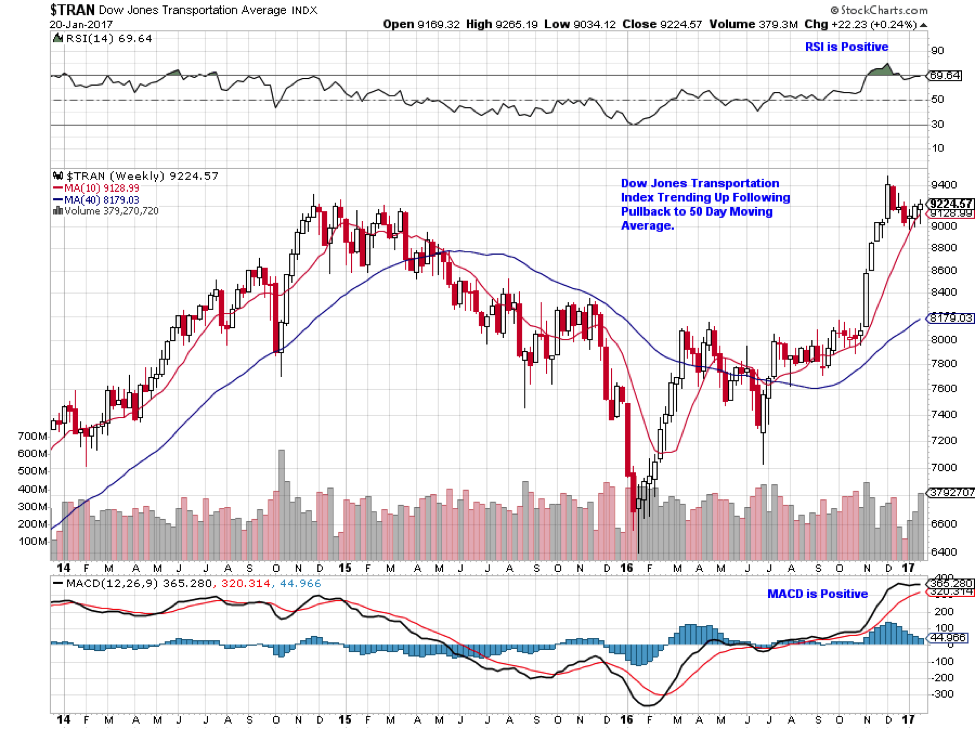
While we are on alert for a possible breakdown of this current sideways move, there are some positives in the market that could head this possibility off.
Below is the Philadelphia Semiconductor Index which is in a confirmed uptrend. Historically, positive action in these risky technology stocks is a sign of investor confidence. The other chart below shows the Dow Jones Transportation Index which is currently trending up after a pullback to its 50 day moving average following a 15% rally. A positive move in this index shows confidence as well as demand for goods needing to be transported can signal a strong economy.
WEEKLY CHART OF SEMICONDUCTOR INDEX
 WEEKLY CHART OF DOW TRANSPORTATION INDEX
Lastly, the fact that we’ve been able to sustain a sideways move given all of the uncertainties surrounding possible fiscal and regulatory policy changes is another positive for this market. That said, we are entering the thick of earnings season which can always be quite a ride.
Mary Ellen McGongle
MEM Investment Research
www.memInvestmentresearch.com