Market Recap for Friday, October 9, 2015
There wasn't much news out towards the end of last week so all eyes were on overseas action and technical developments here in the U.S. Of course, earnings season is kicking into gear and that now becomes more of a focus as well. The overseas action has been solid. In Asia, the China Shanghai Composite ($SSEC) gained more than 3% overnight to close above 3250 for the first time since the late August drop. Its 20 day EMA had provided stiff resistance but the SSEC closed above that key moving average for the second consecutive session. Japan's Nikkei ($NIKK) had recently printed a positive divergence on its MACD, suggesting that momentum was slowing to the downside. Since that time, it's rallied more than 1500 points and appears destined for a test of 19000 and its 50 day SMA. That will likely reset its MACD at centerline resistance and then we'll go from there. Here's a chart to illustrate:
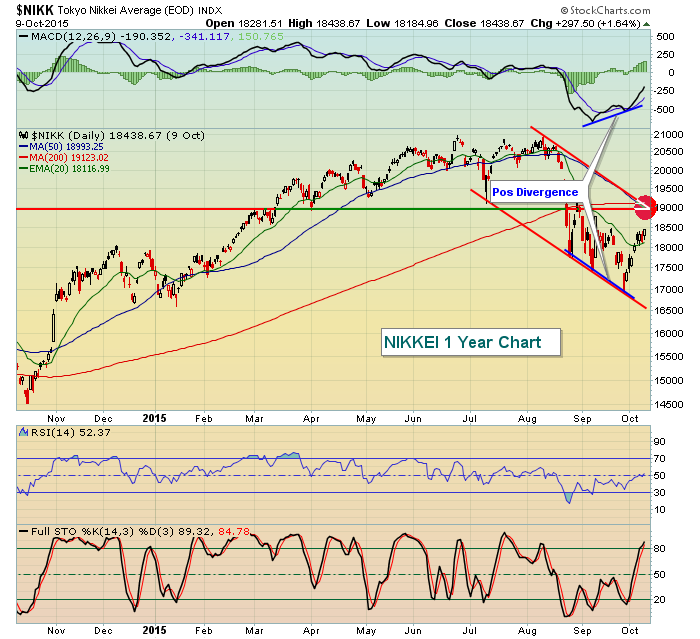
The 19,000 level is important on a number of different fronts. Obviously, that's where the 50 day SMA resides. But if I connect the recent lows in the downtrend and use that same slope from the August highs to create a down channel, you can see that potential down channel would also intersect that 19,000 number. In the past, 19,000 has also been a key price support/resistance level. Finally, it's a psychological milestone. So there's still another 3% potential upside in the NIKK before a more significant technical test is upon us.
The European markets have also strengthened with the German DAX ($DAX), London Financial Times ($FTSE) and French CAC 40 ($CAC) all now trading above RISING 20 day EMAs. The problem now shifts to the longer-term weekly charts where falling 20 week EMAs have made death crosses below their corresponding 50 week SMAs. Those tend to be more indicative of possible bear markets so how prices react as we approach the 20 week EMAs provide us clues as to the depth of a possible decline.
In the U.S., trading was quiet on Friday with NASDAQ volume not quite reaching 1.8 billion shares after 11 consecutive sessions above 2 billion. Healthcare and technology shares led the rally, but we'll see if the buying continues as we head into options expiration week.
Pre-Market Action
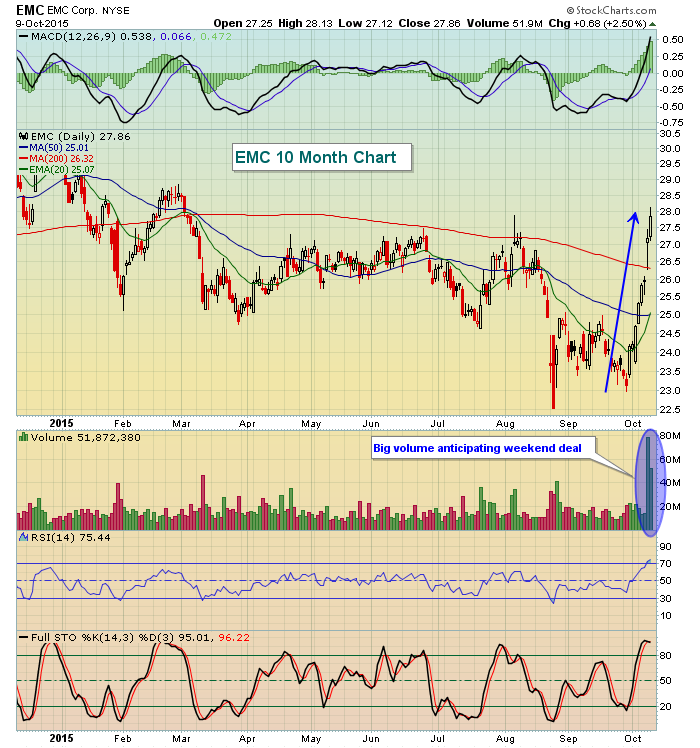
Well, the big news of the morning is Dell's acquisition of EMC Corp (EMC) for roughly $67 billion. The deal values EMC at $33.15 per share which includes $24.05 in cash and a special stock that will track the performance of VMware (VMW). Traders are not exactly in love with this deal this morning as EMC trades higher by just .90 at 28.76 (at last check), well below the acquisition price. During all the excitement, EMC pre-announced top and bottom line results that failed to meet Wall Street consensus estimates. Take a look at the EMC chart - perhaps much of the good news was already built in given the price appreciation the past couple weeks and the volume escalation on Thursday and Friday of last week:
As mentioned above, Asian markets were strong overnight while European markets were a bit more mixed. The German DAX is off its earlier highs this morning, but is still higher by 0.2%. The FTSE and CAC currently trade lower.
Current Outlook
The bulls have been able to clear some important technical hurdles - and do so on better than average volume. On the NASDAQ, for instance, closing price support at 4500 held and we've since seen its 20 day EMA cleared on solid volume. That's a start to technical repair and shouldn't be overlooked. But there's been plenty of damage inflicted so the bulls' work isn't done. As a reminder, let's take another look at the NASDAQ's daily chart:
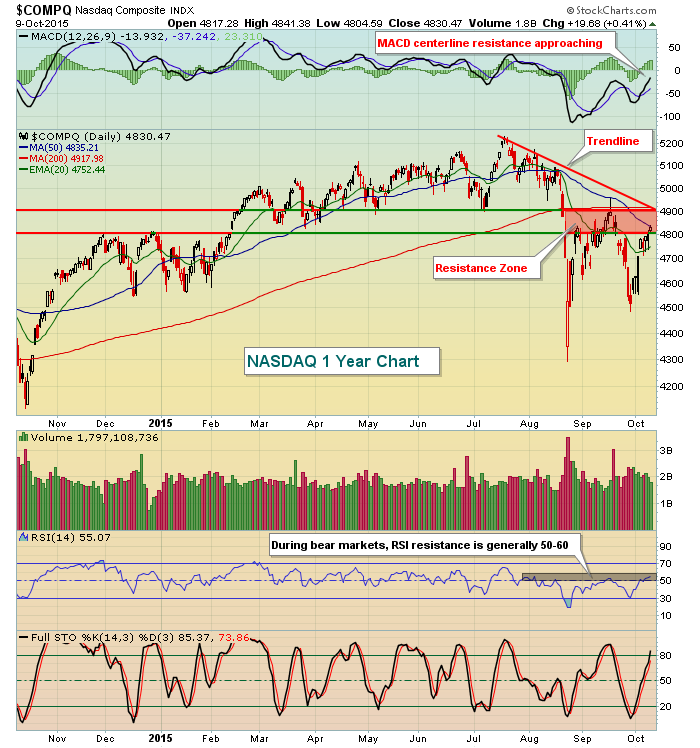
There will be plenty of price, moving average and trendline resistance ahead, but perhaps more important than what we see here is what we see on the longer-term weekly charts. Take a look at a longer-term perspective of the NASDAQ:
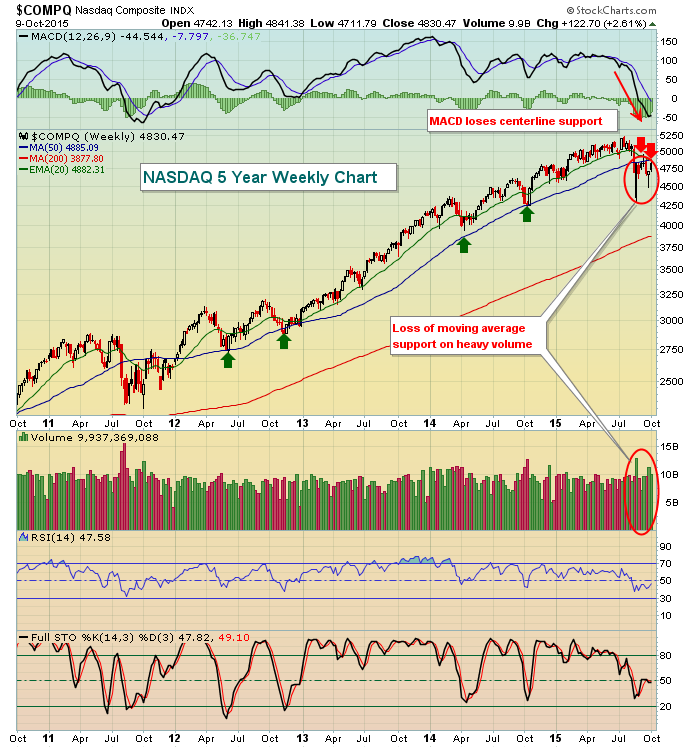
The weekly charts show a much more ominous picture. The heavy volume taking place below key moving averages with the weekly MACD moving beneath centerline support suggests that the bears are currently in control of the action in the bigger picture, despite the recent rally. The good news is that we're about to move into the best time of the year historically - late October through mid January. Unfortunately, we're not quite there yet. And before we get there, we have to negotiate the WORST week of the year historically. More on that later, just know it's in the offing.
Sector/Industry Watch
I don't often look at gold ($GOLD), primarily because it's a more defensive play and I tend to be a bit more aggressive in my trading. Also, during periods of dollar strength, the absolute last place you want to think about investing is gold. There's a very strong inverse correlation between the two that has existed for a long time and can be illustrated quite simply. Check this out:
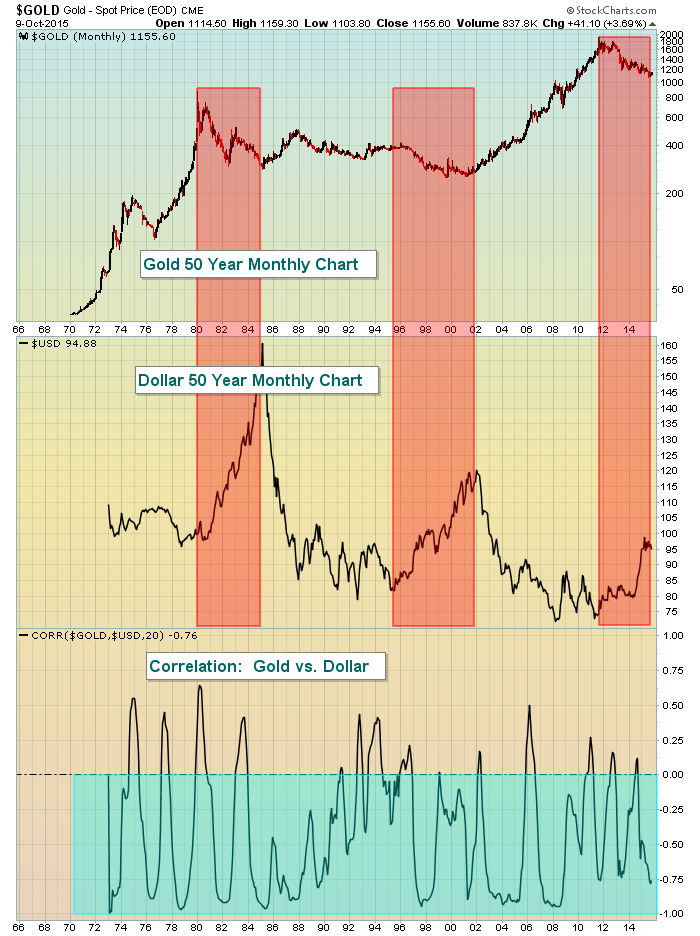
Gold recently ended a decade-long parabolic rise from 2002 to 2012. It had a similar rise in the late 1960s through the 1970s as the dollar weakened. But the dollar's parabolic rise from 1980 to 1984 sent gold lower by 60%. The next big rise in the dollar from 1995 to 2002 saw gold decline 35-40%. The bottom of the above chart shows us that there's a very strong NEGATIVE correlation between the direction of gold prices and the direction of the U.S. dollar. As you can see at the far right hand side of the chart, the U.S. dollar recently pushed to 11 year highs and gold has been tumbling. Every rally in gold has been followed by a fresh low since late-2011. In the near-term, gold has a chance to rally so long as the dollar doesn't break out to fresh highs. If the U.S. dollar clears 100, gold is the last place you want to be invested. To the contrary, a move in the dollar below 92 would likely get traders much more excited about gold. Personally, I believe gold will be below 1000 within the next year with the 1250-1300 marking near-term resistance on any short-term strength.
Historical Tendencies
On the S&P 500, October ranks as the 7th best calendar month in terms of annualized return. The annualized return for October since 1950 is 10.01%, slightly better than the 9% average annualized returns the S&P 500 has enjoyed over those same years.
Key Earnings Reports
None
Key Economic Reports
None
Happy trading!
Tom
