Market Recap for Friday, October 16, 2015
Friday's action was fairly calm for an option expiration day, especially given that there's so much at stake technically. We did see a sudden drop in the early part of the afternoon session only to be followed by a strong finish into the close. That strong finish left the bulls in charge in the short-term, but longer-term issues remain in focus as we approach a very poor time of the year historically.
Consumer stocks performed well on Friday, which was a pleasant change from Thursday's action, but consumer staples were leading while discretionary stocks lagged somewhat. Still, it was improvement over what we saw earlier in the week as consumer stocks uncharacteristically took the prior the several days off. The bull market has been mostly consumer-driven so it's a bit unnerving to see consumer stocks lag. Despite the recent weakness, however, we do still remain in a market with solid overall action from consumer stocks. The following chart is a reminder of how important the ratio is between consumer discretionary stocks and consumer staple stocks (XLY:XLP). The S&P 500 takes its cue from this ratio or vice versa depending on how you view it. What I can tell you is that there is a strong positive correlation between the XLY:XLP ratio and how the S&P 500 performs. Check out this 15 year weekly chart to illustrate:
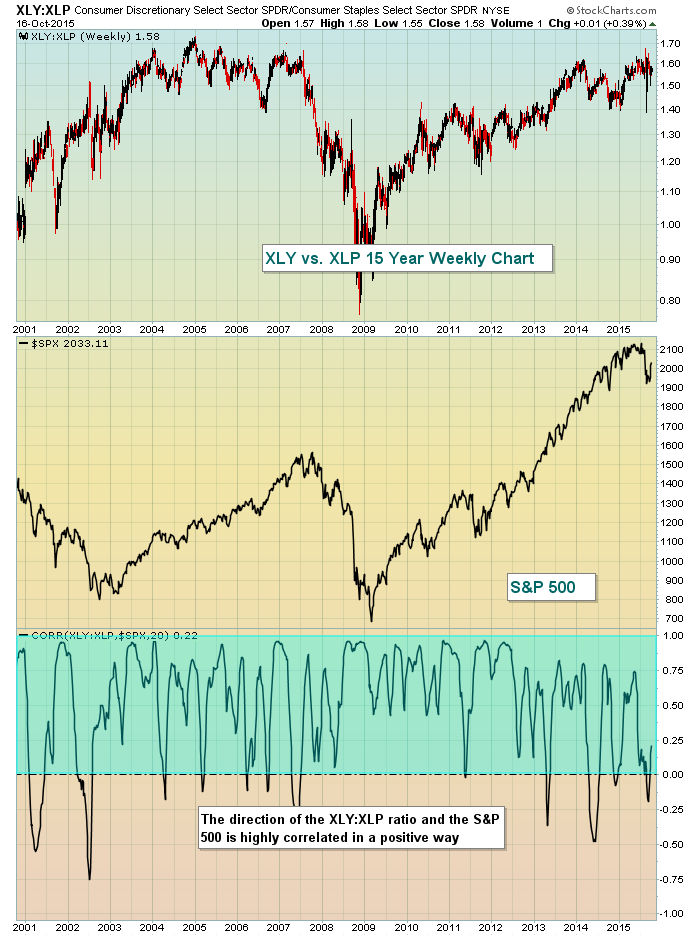
That blue shaded area is a reminder of how closely these two tend to correlate. Therefore, it makes sense to keep a close eye on the XLY:XLP ratio. A close above 1.60-1.62 would be VERY bullish for equities while a drop below the 1.40 level would suggest we could be in for much more weakness.
Pre-Market Action:
Futures have turned slightly negative, following the lead of European markets and earnings disappointment from Morgan Stanley (MS). The FTSE, DAX and CAC were all up this morning, but at last check only the DAX remained higher. In addition, financials are likely to struggle after MS indicated they have come up short of earnings expectations. That will only add to a negative technical outlook that can be seen from the chart below:
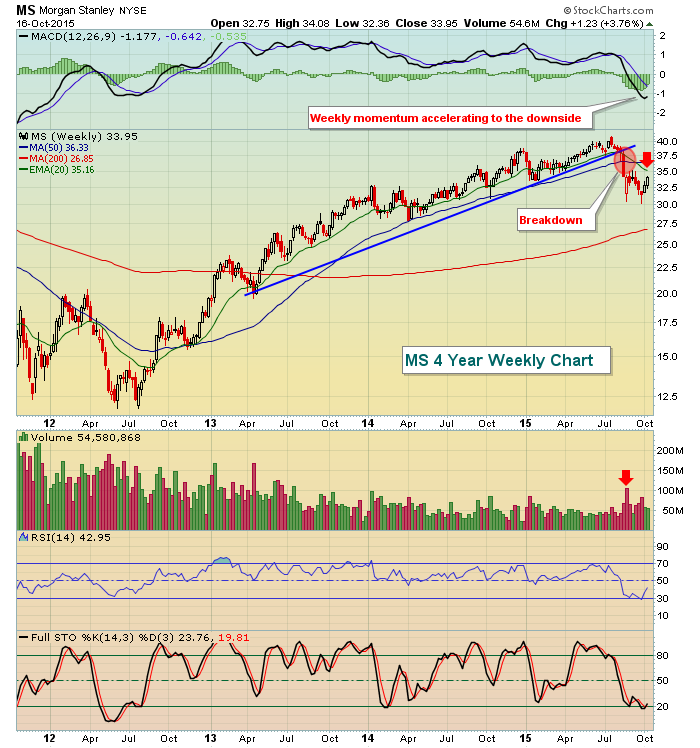
Barring a solid recovery after the open, it appears MS is heading lower. This earnings miss comes on the heels of disappointing results from Goldman Sachs (GS) last week and seems to emphasize that banks and investment companies are hurting this quarter. Until technical conditions improve, you might want to consider avoiding the group.
Current Outlook
The action in the S&P 500 and the German DAX tends to be very positively correlated so it's worth mentioning that the DAX finished on Friday up against its key 50 day SMA. Furthermore, the declining 20 week EMA provides a "bigger picture" test and that's rapidly approaching. Check this out:
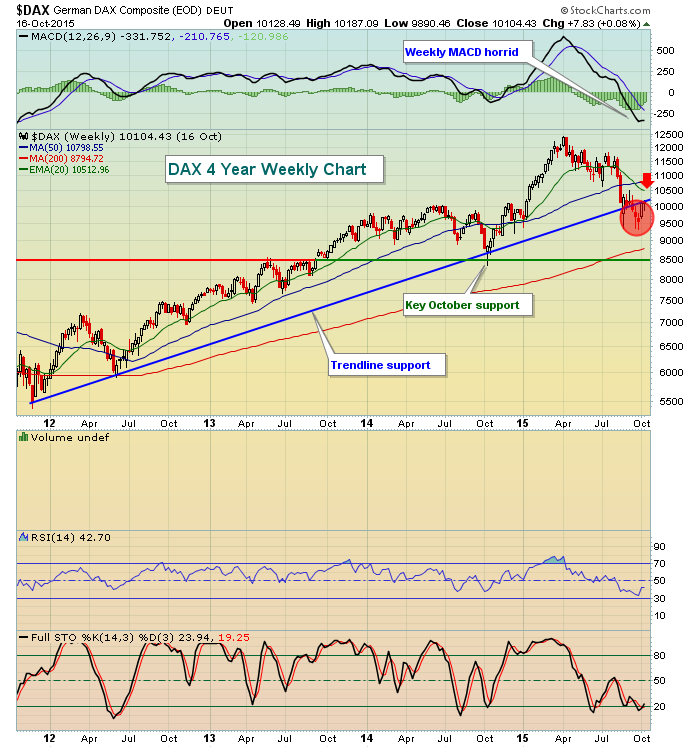
The DAX has recovered 700-800 points off the recent low, but with every bounce higher a bigger test draws near. As we approach this historically weak period for stocks, major overhead tests await and that makes entering long positions very difficult. On the other hand, until October lows are taken out, the series of higher highs and higher lows that underscore a bull market remain in play. Hence, the battle between bulls and bears that's currently taking place.
Sector/Industry Watch
Recently, I highlighted Tobacco, a consumer staples industry group. Today, I'll highlight another from this space - Sodas ($DJUSSD). After a solid uptrend the past several years, the DJUSSD has been sideways consolidating for the past year awaiting its next breakout. Pepsi (PEP) recently reported strong results and Coca Cola (KO) is on deck to report this week. Check out the bullish chart pattern for the group:
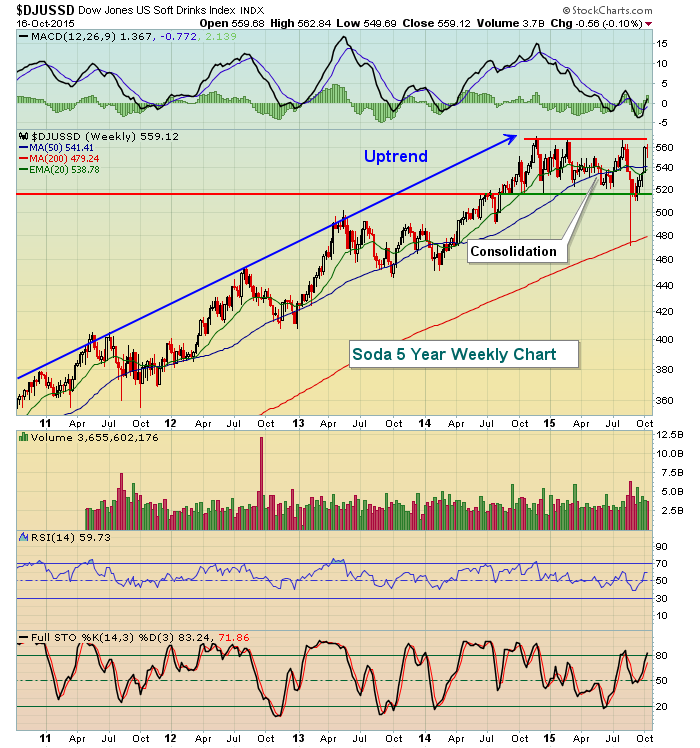
A breakout above 570 would likely signal the next leg of its uptrend.
Historical Tendencies
The 19th of the calendar month (today) has been the worst calendar day for the S&P 500 since 1950 - even if we ignore Black Monday, October 19, 1987. The annualized return for the 19th of the month (all months, not just October) is a staggering -34.10%. October 19th has produced annualized returns of -142.42%.
If you're looking for historical strength from the NASDAQ or Russell 2000, that's not happening. The 19th of all calendar months has produced the following annualized returns on each of these two indices as follows:
NASDAQ (since 1971): -30.13% (the 20th calendar day actually produces worse results with annualized returns of -34.80%)
Russell 2000 (since 1988): -34.17% (the 7th calendar day is the worst here, producing annualized returns of -40.49%)
Key Earnings Reports
HAL: $.31 (actual) vs. $.27 (estimate)
MS: $.34 (actual) vs. $.66 (estimate)
IBM: $3.33 (estimate) - reports after closing bell today
Key Economic Reports
October housing market index to be released at 10:00am EST: 62.0 (estimate)
Happy trading!
Tom
