Market Recap for Thursday, February 11, 2016
It was another very rough outing for financials (XLF) in general and banks ($DJUSBK) in particular with losses of 3.06% and 4.28%, respectively. The banking issue is most definitely a global one as has been very well documented here at StockCharts.com by me and other SC analysts. The problem is that a poorly performing banking group means less credit availability. And less credit availability means less global economic growth, possibly even a global recession. That's why the stock market is dropping so rapidly and money is rotating toward safety - it's the growing fear of further economic weakness ahead. It has little to do with anything that's already transpired. That's the beauty of technical analysis - we can observe performance of global markets and assess the likelihood of various scenarios. Currently, there's a high degree of probability that we're entering a lengthy period where investors will seek out safety and that's bad news for stock investors.
There will be periods of short- to intermediate-term strength, however, and we may be entering one of those now. See the Current Outlook section below for more details on technical changes that have taken place in the past couple days.
Mortgage finance ($DJUSMF) bucked the selling trend in financials on Thursday and appears poised to continue its rally. Here's a chart that reflects the slowing price momentum (positive divergence on MACD) accompanied by a moderate volume reversing candle:
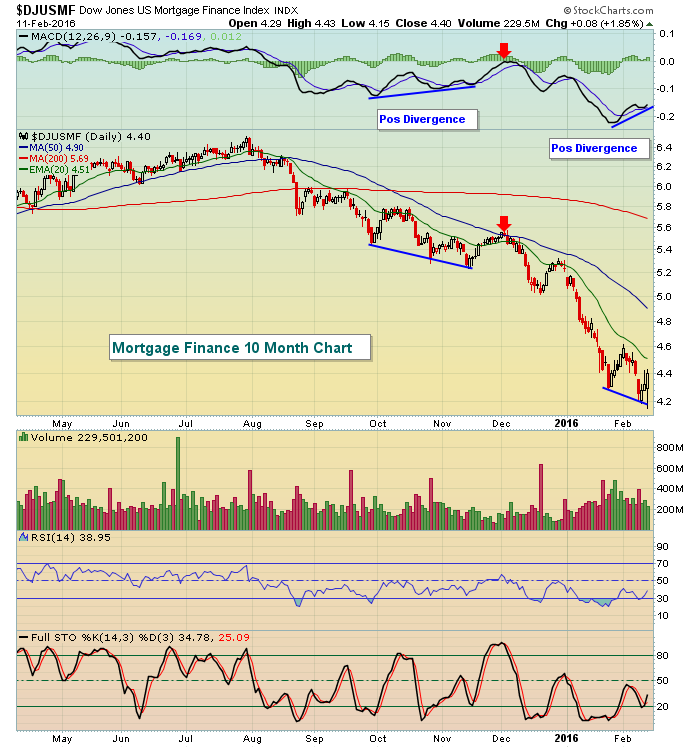 The latest price low shows a much higher MACD reading, a positive divergence and slowing price momentum. Thursday's reversal suggests the short-term selling is likely over. It's not a guarantee - nothing is in technical analysis - so stops must be kept in place. Also, realize we're trading by bear market rules so short-term strength should be used to book profits. The last positive divergence is reflected and shows that strength ended once the MACD centerline and 50 day SMA were tested. That would be the extent of what I'd be looking for out of this rally. If prices do rise, I'd take profits along the way as resumption of the downtrend could occur at any time. If price rises, consider raising your stop underneath price action to avoid holding long-term on the next breakdown.
Consumer discretionary (XLY) and technology (XLK) led the reversal on Thursday and that's a positive short-term sign for further strength in the days ahead. It won't hurt that the stock market tends to rally from the 11th of the calendar month to the 18th.
Pre-Market Action
Asian markets were hit hard overnight, especially in Tokyo where the Nikkei ($NIKK) fell another 4.84%. There are serious technical issues in that benchmark index. Both China's Shanghai Composite ($SSEC) and Hong Kong's Hang Seng Index ($HSI) were lower as well.
The tide has turned in Europe, however, as prices are higher in France ($CAC), Germany ($DAX) and England ($FTSE). The gains range from 1.5%-2.0% as all three bounce off oversold conditions - as I expect to see here in the U.S.
Retail sales came in slightly better than expected and that won't hurt today's action. Neither will the historical bullishness that we typically see in mid-February. Throw in oversold conditions and positive divergences and we have the recipe for a countertrend rally.
Current Outlook
There are several factors that suggest the probability of a rally from this level is growing.
1. Market makers are likely on the long side
Volume surged on Thursday and our major indices rallied in the afternoon. This is indicative of market maker buying and I try to be on the side of the market maker as often as possible. Why? Take a look at their track record. I recall back in 2010 when Goldman Sachs (GS) CEO Lloyd Blankfein said that GS' market making unit made money every day during the first quarter of 2010, with daily profits of more than $100 million on 35 of 63 trading days. So do you want to trade alongside them or against them?
2. Major indices are oversold
After the recent selling, RSIs are in the tank. The hourly RSIs hit or approached 30 on our major indices on Thursday. The daily and weekly RSIs aren't much better. Weekly RSIs at or near 30 usually result in buying sooner rather than later. That is not always the case so we must remain prudent with tight stops in place. Respect the lows that printed on Thursday.
3. Positive divergences are everywhere
Positive divergences on the MACD are solid signs of slowing price momentum. Those, coupled with high volume reversing candlesticks, can produce powerful countertrend rallies during a bear market. Again, they provide no guarantees, but as a trader, I'm looking for increased probabilities. Then I manage my risk by using stops. Raising stops during a countertrend move should also be considered. Capturing small profits is better than the alternative of capturing no profits - or worse yet, losses. Check out the following weekly and daily charts on the NASDAQ:
NASDAQ - weekly:
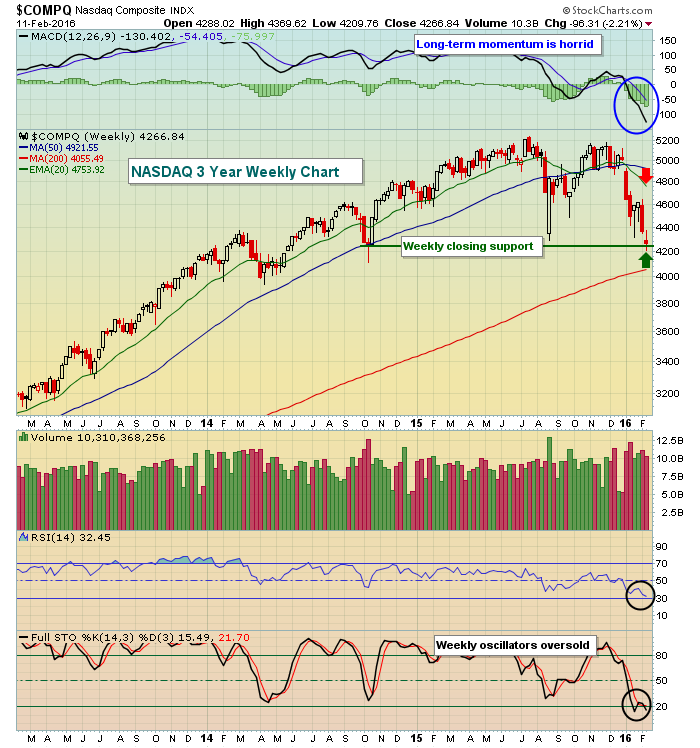 Couple things here. First, the combination of price/volume is very bearish. Secondly, the weekly MACD is pointing straight down. That suggests any rally is likely to be capped by the declining 20 week EMA. But that's currently at 4754. That's more than 10% higher from current price. Keep in mind, however, that this moving average will continue to fall rapidly as prices have tumbled. In other words, don't expect a 10% rise. But work with me here. 4754 is the current number on the weekly chart. Now let's move on to the daily chart:
NASDAQ - daily:
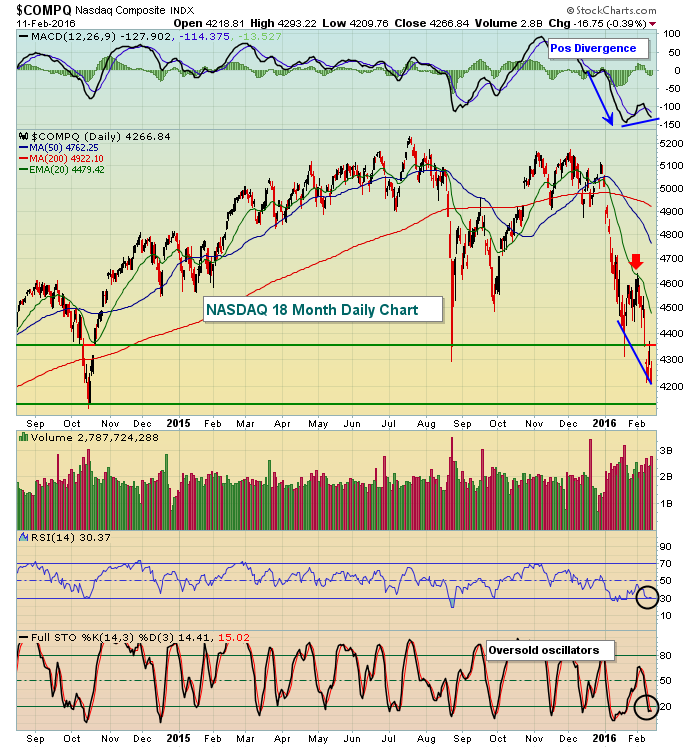 There are confirming signs of a potential reversal on the daily chart. First, the daily RSI and stochastic are both oversold. Second, we're in a trading range between 4150-4350, which has provided solid price support in the past. Third, those red hollow candles are suggesting accumulation intraday. Four, the recent price low is accompanied by a higher MACD reading, or positive divergence. The last low showed a MACD that was pointing straight down (blue arrow) and the ensuing rally failed at the declining 20 day EMA, as would be expected. This time, it's possible the countertrend rally extends to the 50 day SMA to reset the MACD near its centerline. The 50 day SMA currently resides at 4762. Now look back to the falling 20 week EMA at 4754. Both charts have key moving average resistance within 8 points of one another. Again, I wouldn't hold off on those moving average tests to close out long trades. I just want to point out the difference in the possible rally here vs. the prior low.
To recap, based on the way the market is behaving both in terms of price/volume action and sector rotation, I believe we're in a bear market and this downtrend should be respected. Trading on the long side is risky for sure as impulsive selling can take place at any time. The moving averages identified above do NOT have to be tested. This rally may fall short or may not even get started. I just believe the probabilities have increased. As a result, I closed my short positions on Thursday and I may add light positions on the long side with tight stops in play. That's how I approach long trades in a risky bear market.
Sector/Industry Watch
Over the past month, consumer discretionary (XLY) has trailed only financials as the worst performing sector. Over the past three months, the XLY trails only the XLF and energy (XLE). The XLY has reached key price support and has a positive divergence on its MACD so trading this area short-term makes sense technically as tight stops can be utilized just beneath price support. Here's the chart:
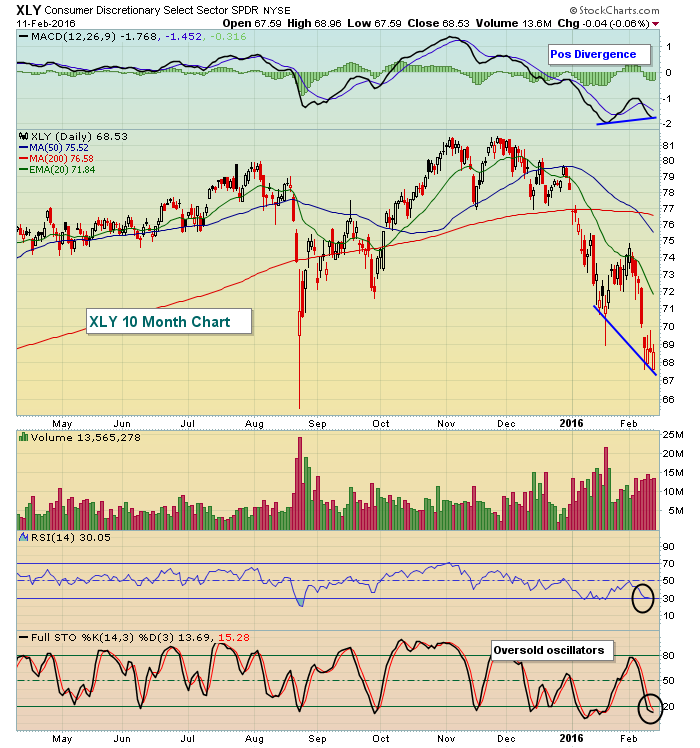 The XLY is approaching the August lows but selling momentum appears to be slowing. The two red hollow candles the past three trading days is indicative of possible accumulation by market makers, which will allow for the short-term rally. I believe the short-term trading risk has shifted to shorts for now. Again, I'd be quick to begin taking profits on any long trading position as we are now living by bear market rules where rallies are generally short-lived.
Historical Tendencies
Yesterday began a period of historical bullishness for the Russell 2000. Since 1988, the Russell 2000 has racked up annualized returns as follows through February 16:
February 12 (today): +49.60%
February 15 (Monday): +44.86%
February 16 (Tuesday): +55.55%
Key Earnings Reports
(actual vs. estimate):
HPY: .69 vs .67
IPG: .66 vs .62
MT: (.20) vs (.26)
XRAY: .65 vs .65
Key Economic Reports
January retail sales released at 8:30am EST: +0.2% (actual) vs. +0.2% (estimate)
January retail sales excluding autos released at 8:30am EST: +0.1% (actual) vs. +0.1% (estimate)
January retail sales excluding autos and gas released at 8:30am EST: +0.4% (actual) vs. +0.3% (estimate)
December business inventories to be released at 10:00am EST: +0.1% (estimate)
February consumer sentiment to be released at 10:00am EST: 92.5 (estimate)
Happy trading!
Tom
