Market Recap for Tuesday, March 15, 2016
Apple (AAPL) resumed its upward climb on Tuesday, breaking to its highest close since the first trading day of 2016. AAPL's strength led computer hardware ($DJUSCR) to outsized gains of 1.42%, technology (XLK) to the best finish among sectors and kept the NASDAQ above its 20 hour EMA. Here's the visual on AAPL:
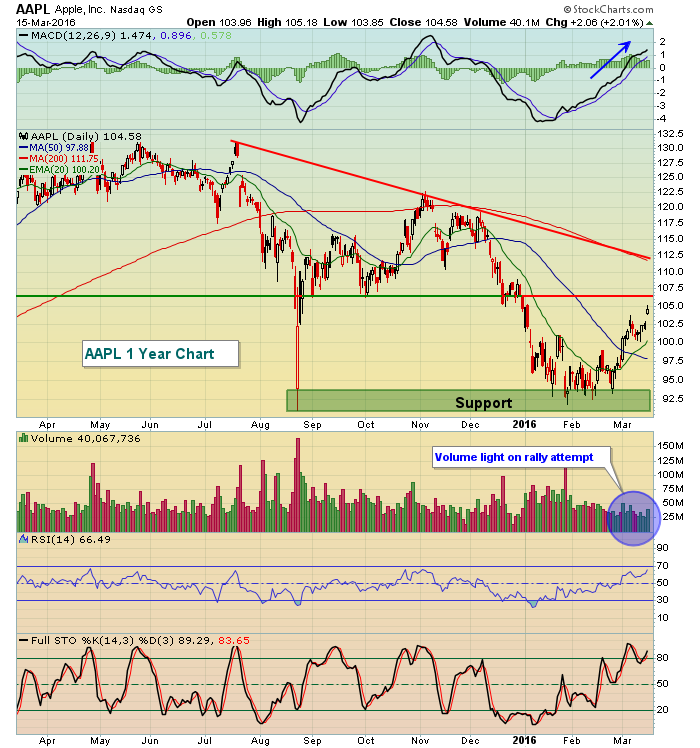 AAPL has shown a few positives, mostly in terms of price and moving average breakouts. But volume, as you can see, does not reflect strong accumulation in my opinion. Furthermore, there are still key areas to clear in order to resume its longer-term uptrend. But short-term momentum has certainly improved.
It wasn't all roses for the U.S. stock market on Tuesday as three of our four major indices finished lower and the healthcare sector (XLV) saw weakness across all industry groups, particularly biotechs ($DJUSBT), which fell 2.35%. Biotechs appear headed for lower prices as Tuesday's selling sent the industry group to its lowest close since February 12th, just one day after the bottom was set on the S&P 500. That cannot possibly be viewed in a positive fashion as the S&P 500 is more than 11% higher than where it was at the February 11th bottom. Check out the technical picture on biotechs, and especially how the group has been performing vs. the S&P 500:
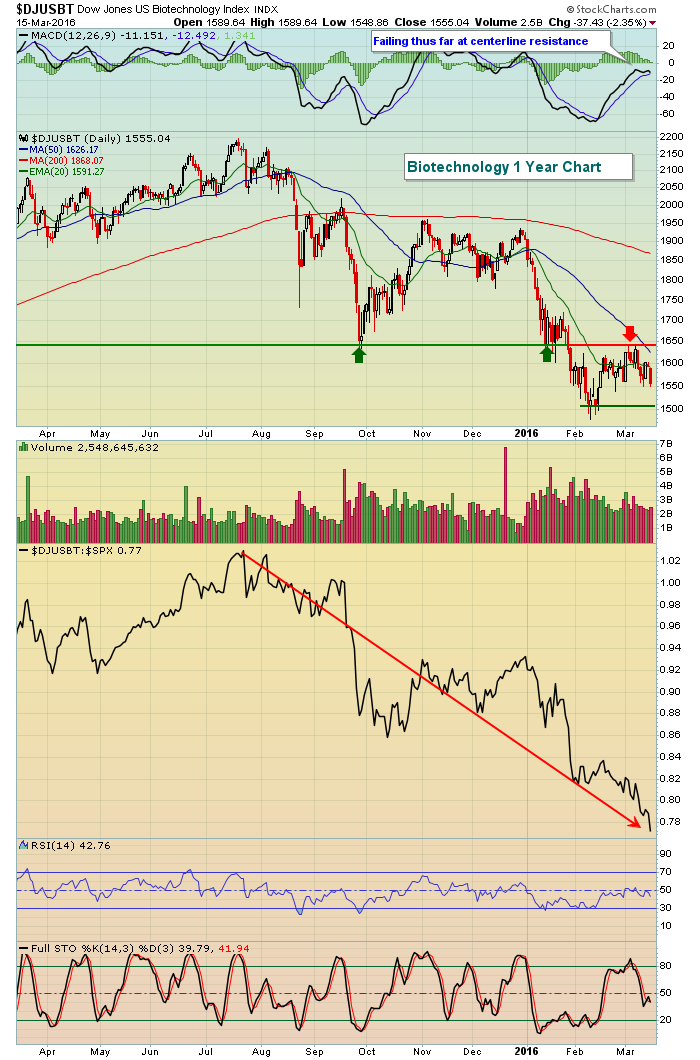 The good news is that the DJUSBT has held the February price low, but that's a tiny consolation prize considering the strength of the S&P 500 over the same period. In fact, the relative weakness of biotechs vs. the S&P 500 is quite apparent from the downwardly sloping arrow above.
Pre-Market Action
Oracle (ORCL) surprised traders with a solid earnings beat on Tuesday after the close and that could help technology stocks retain momentum. ORCL reported EPS of .64 in its latest quarter, topping Wall Street's expectations of .62 per share. Revenues came up short, but traders were looking past that miss as ORCL's board of directors authorized an additional $10 billion share repurchase program. ORCL is higher by 3.6% in pre-market trading and should provide another boost to technology.
U.S. futures are down slightly at last check as the recent consolidation looks to continue - at least until we hear from the Fed later this afternoon. The FOMC meeting announcement is scheduled for 2pm EST so look for increased volatility just after this announcement. We're at a pivotal area technically on the charts. Therefore, pay particular attention to how we close today for short-term directional clues.
Current Outlook
The longer-term picture remains cloudy, but improving. Therefore, I'll continue to focus on near-term support and resistance to watch. Yesterday, the Russell 2000 was extremely weak, tumbling 1.62% while the Dow Jones finished with a small gain. Technically, the Russell 2000 remains relatively strong so it will be important to see if the short-term trading range holds support. Here's the latest on small caps:
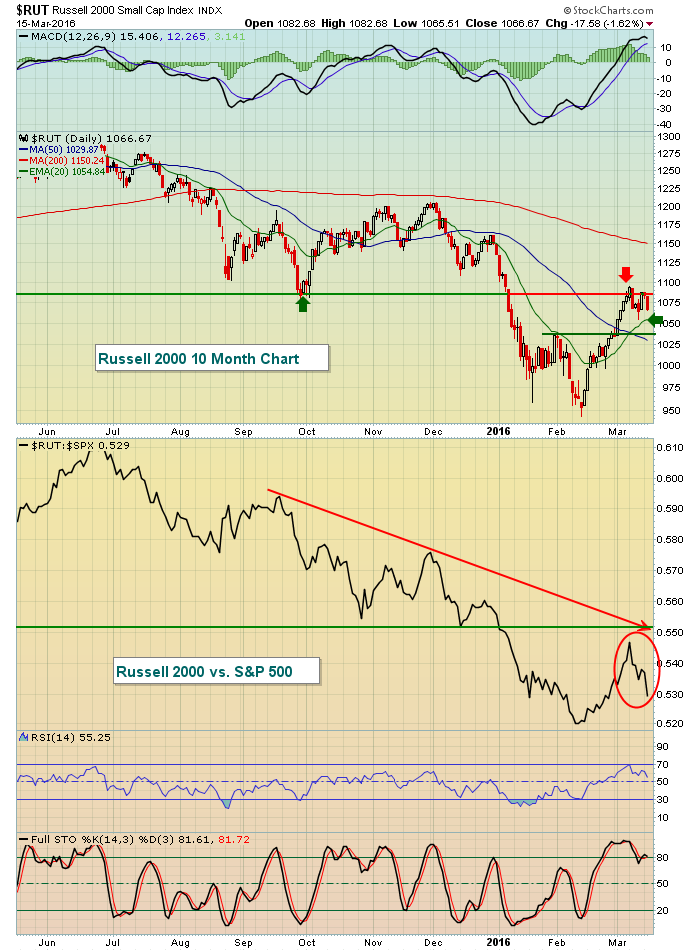 From a bearish perspective, one big problem that remains is that most relative ratios that depict whether market participants are in a "risk on" or "risk off" mode have not recovered sufficiently during the current stock market rally. The red circle above shows that money has quickly rotated away from the Russell 2000 relative to the S&P 500. That's a bearish development. So now the question becomes....can the Russell 2000 regain its strength to clear price resistance prior to losing price support. Currently, that trading range is from roughly 1035-1095.
Sector/Industry Watch
The Dow Jones U.S. Tires Index ($DJUSTR) has been a very bullish group for several years as reflected below:
 The long-term uptrend remains intact and the recent period of weakness and subsequent recovery looks strikingly similar to what the group experienced in the second half of 2014. I'd remain bullish this space unless the trendline is broken.
Historical Tendencies
Yesterday, I discussed the NASDAQ's tendency to perform better during the first half of March as opposed to the second half. Here are the annualized returns of the S&P 500 for the following two periods since 1950:
March 1-15: +17.95%
March 16-31: +10.23%
In addition, March 1-15 has produced 57.02% up days while the March 16-31 period has produced only 48.76% up days.
Key Earnings Reports
(reports after close, estimate provided):
CTRP: .00
FDX: 2.33
GES: .58
JBL: .52
WSM: 1.59
Key Economic Reports
February CPI released at 8:30am EST: -0.2% (actual) vs. -0.3% (estimate)
February Core CPI released at 8:30am EST: +0.3% (actual) vs. +0.2% (estimate)
February housing starts released at 8:30am EST: 1,178,000 (actual) vs. 1,146,000 (estimate)
February building permits released at 8:30am EST: 1,167,000 (actual) vs. 1,202,000 (estimate)
February industrial production to be released at 9:15am EST: -0.2% (estimate)
February capacity utilization to be released at 9:15am EST: 76.9% (estimate)
Happy trading!
Tom
