Market Recap for Wednesday, May 4, 2016
Wednesday's theme was defense. In many sports circles, defense wins championships. That's not the case with the stock market. Strong "defense" here means skepticism, fear and generally a downtrending stock market. So I'm not a fan of advancing treasuries (TLT, +.55%), utilities (XLU, +1.17%) and consumer staples (XLP, +.30%), while more aggressive areas of the market lose ground.
Energy (XLE, -1.44%) was the weakest sector once again as it continues to either be the best performing sector or worst performing sector on a daily basis. It's been feast or famine there for weeks. But slowing momentum in the industrials (XLI, -1.23%) space has nearly played out and airline stocks ($DJUSAR) could not be happier as they've taken the brunt of the industrial selling the past couple weeks. First, let's look at the latest technical developments on the XLI:
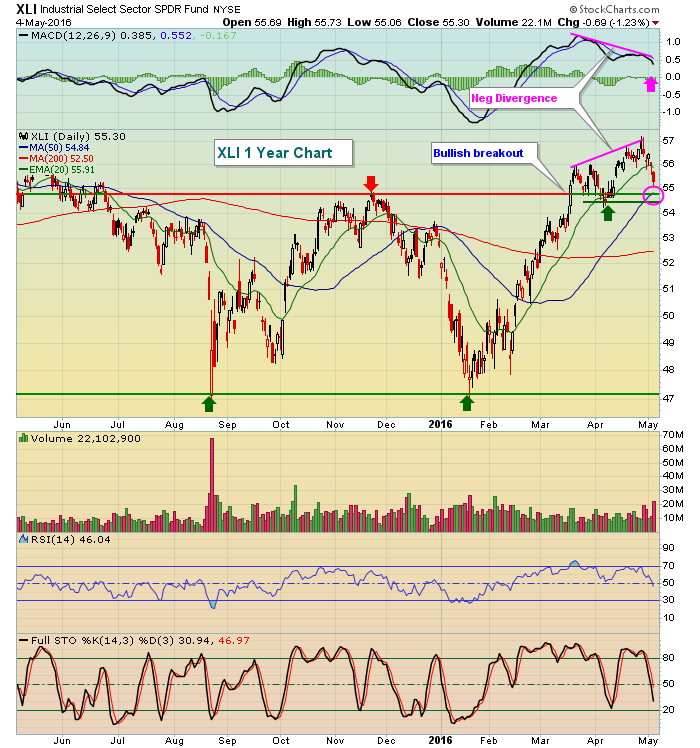 The XLI made a very important breakout above the 54.75 area in mid-March, clearing the previous November high (red arrow). That was important because we had a double bottom in place from the August and January lows (green arrows). But after breaking out, momentum slowed as evidenced by the negative divergence. That typically results in a 50 day SMA test (pink circle) and/or a MACD centerline reset (pink arrow). It appears that's where we're heading. Airlines have been suffering the most from the recent selling in industrial stocks and that group's MAJOR support is highlighted in the Sector/Industry Watch section below.
Pre-Market Action
U.S. futures are modestly higher this morning as crude oil ($WTIC) is up more than 4%. Look for a recovery in energy stocks (XLE) today, at least in early action. Futures are higher despite initial claims being reported well above Wall Street estimates this morning. Several Fed members will be speaking today, just one day ahead of a key employment report, which will be released at 8:30am EST.
Asian markets were mixed as Tokyo's Nikkei ($NIKK) was closed. In Europe, all key markets are hugging their flat lines as they attempt to recover from recent weakness.
Current Outlook
Rising volatility ($VIX) is critical to the bears' hopes of a more significant decline and I'm watching the 17 resistance level very closely. Without a VIX push above 17, the chances of a steep decline in U.S. equities are slim. Here's the latest visual on VIX resistance in relation to S&P 500 price support:
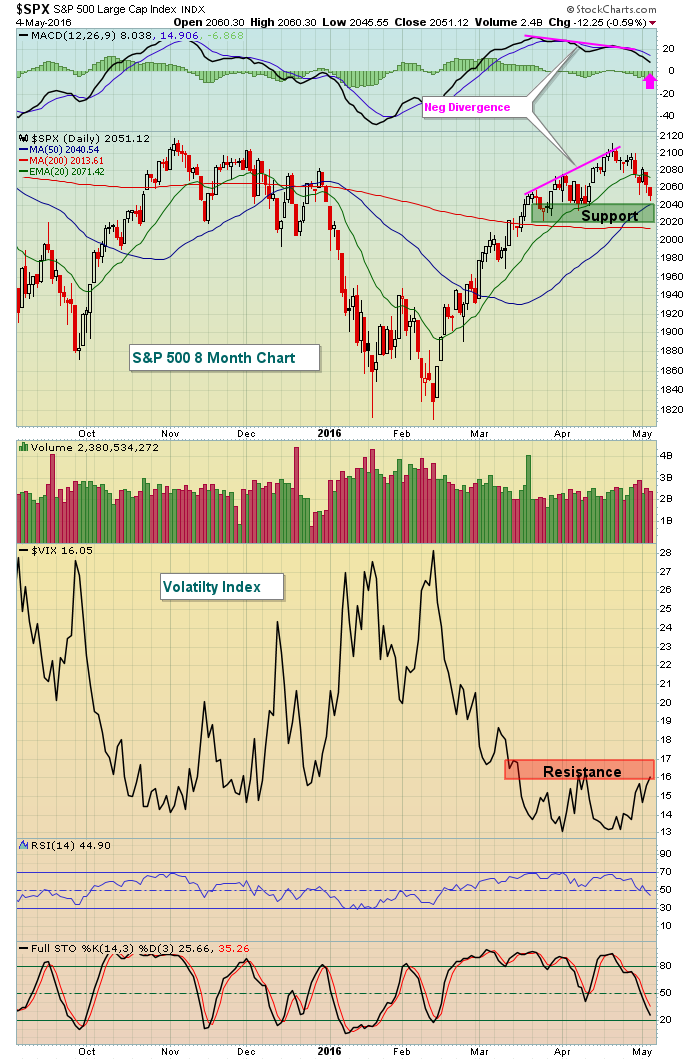 It's also not unusual to see more weakness develop after a negative divergence emerges and price react back to 50 day SMA support, which is where the S&P 500 appears headed - at a minimum. Based on my experience, RSI and full stochastic typically become oversold during periods of rising equity prices at 40 and 10, respectively. The RSI has moved into the 40s and full stochastic is falling rapidly and closed at 25 on Wednesday.
Sector/Industry Watch
Airlines ($DJUSAR) have fallen more than 15% in just the past two weeks. Rising crude oil prices ($WTIC) appear to be taking a toll on the group in addition to the slowing momentum in industrial stocks in general. The selling has sent the DJUSAR down to a critical long-term support level that should be respected, especially with crude oil showing the appearance of a bottom and a renewed uptrend. Check it out:
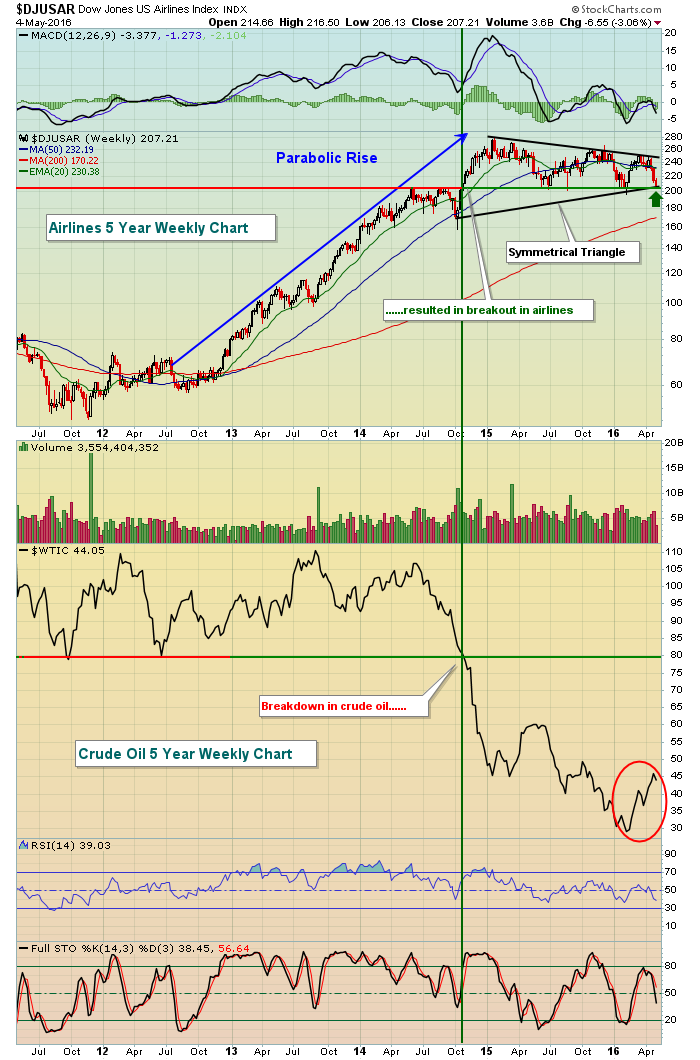 There's both bullish and bearish signals here, depending on your viewpoint. The symmetrical triangle pattern following an uptrend is a continuation pattern. Therefore, watch for a breakout to the upside to confirm the next leg higher. But higher crude oil prices can stop an airlines rally in its tracks and that's what has occurred over the past several weeks. Major price support resides close to 195-200. Loss of that level would clearly be bearish.
Historical Tendencies
The U.S. stock market normally sees seasonal strength through May 5th. But May 6th to May 24th can be a different story. For instance, on the Russell 2000, May is a solid calendar month with annualized returns of +15.39%. Surprisingly, however, the May 5th to May 24th period produces annualized returns of -13.80% over the past 28 years on the Russell 2000. Clearly, early May and the last week of May are very strong periods.
Key Earnings Reports
(actual vs. estimate):
APA: (1.29) vs (.91)
BABA: .20 vs .38
DISCA: .46 vs .44
K: .97 vs .93
LAMR: .95 vs .87
MRK: .89 vs .85
MWW: .05 vs .04
OXY: (.56) vs (.41)
(reports after close, estimate provided):
ATVI: .10
FLR: .86
HLF: 1.07
MTD: 2.44
WYNN: .83
Key Economic Reports
Initial jobless claims released at 8:30am EST: 274,000 (actual) vs. 262,000 (estimate)
Happy trading!
Tom
