Market Recap for Monday, June 27, 2016
The U.S. bond market closed sharply higher on Monday, sending treasury yields tumbling to lows not seen since the post-QE (quantitative easing) days of 2012. Everyone is seeking safety and it was evident throughout trading on Monday. Money rotated into safety and the result was a 10 year treasury yield ($TNX) that dipped below 1.50%. Have a look:
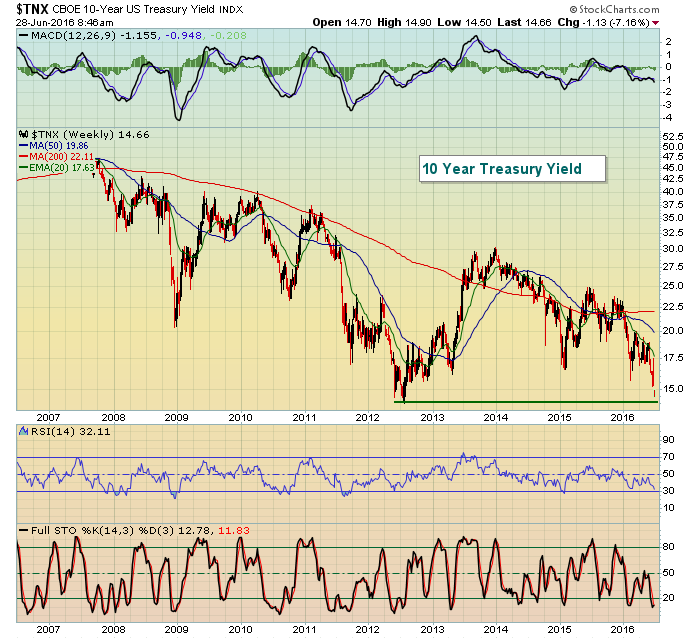 Falling yields are typically bearish for equities because every dollar that's invested in treasuries is a dollar that can't be invested in equities.
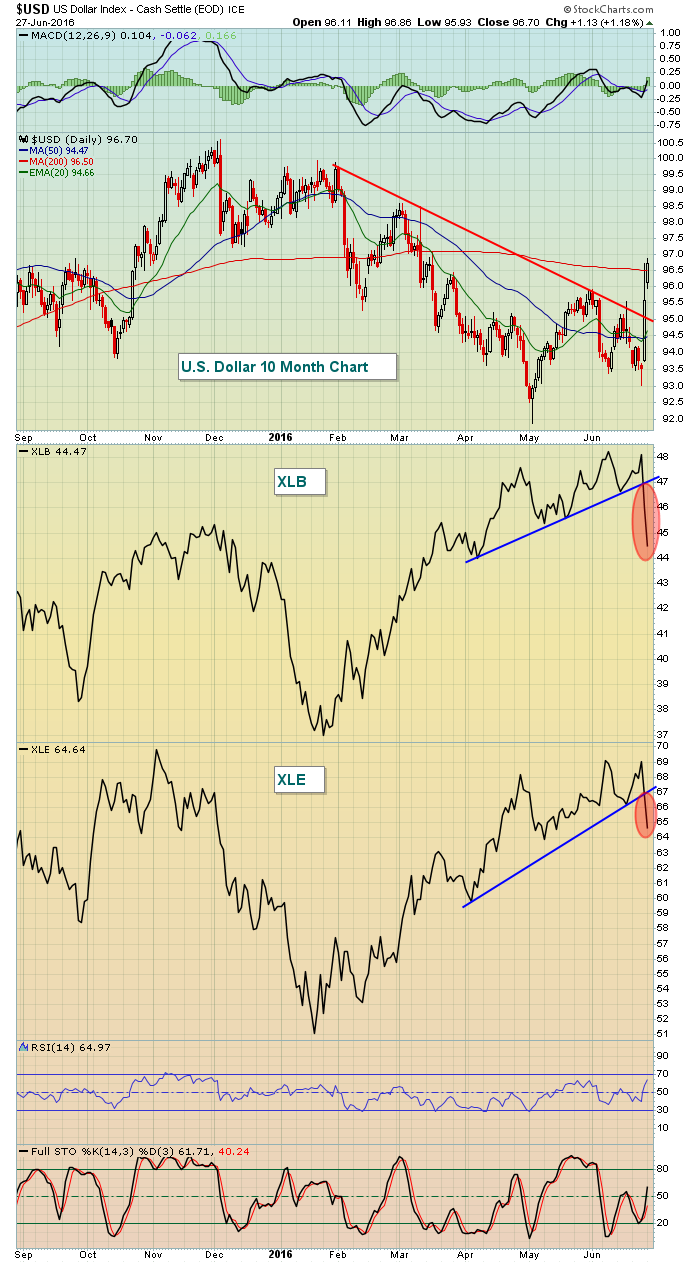
Once again sector performance demonstrated the lack of appetite for risk as utilities (XLU, +0.83%) were the only sector to advance. Consumer staples (XLP, -0.22%) performed very well on a relative basis, while the suddenly strengthening dollar crushed both materials (XLB, -3.37%) and energy (XLE, -3.20%). Check out the inverse correlation the past couple days:
 Aggressive sectors were all hit hard on Monday with financials (XLF, -2.85%) leading the charge. Globally, banks ($DJUSBK) were treated rather harshly with Barclays (BCS) dropping more than 20%.
Pre-Market Action
Just minutes away from today's open, Dow Jones futures are up more than 200 points. The high Volatility index ($VIX) almost guarantees us wild moves in both directions in the near-term so expect more of this.
Asian markets calmed and were relatively flat overnight, while European markets are rallying today. The German DAX ($DAX) is up 250 points and trading back above 9500. Technically, the two key levels on the DAX are price resistance at 9557 and the declining 20 day EMA at 9862. I'll be surprised if the DAX can clear 9557 on a closing basis, but we'll see.
The bond market is flat this morning with the 10 year treasury yield ($TNX) at 1.46% after an initial move earlier to 1.48%.
Current Outlook
The recent heavy selling should provide a short-term ceiling overhead at the declining 20 hour EMA - at least on an initial test. So while this morning's futures look bright, I'd expect to sellers reappear when that EMA is tested. Check it out visually:
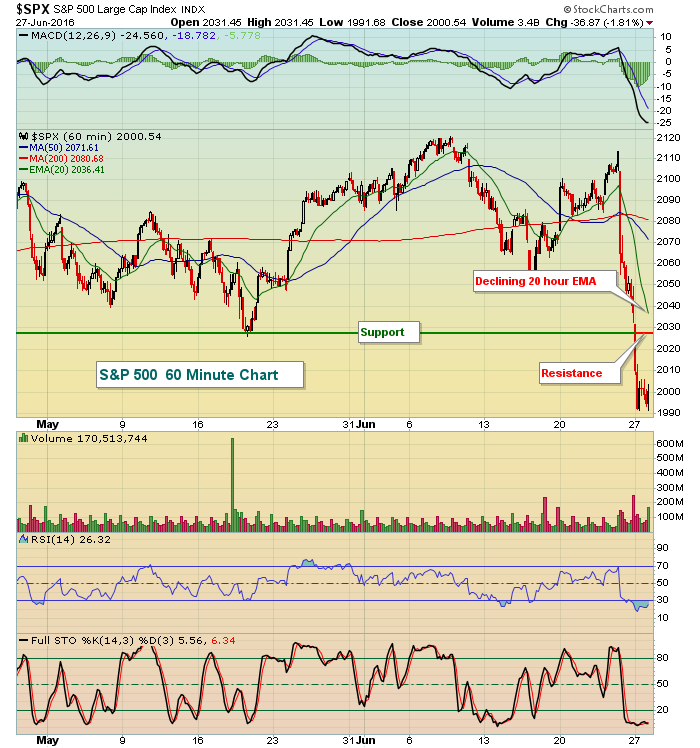 Based on the above, I'd consider the 2025-2030 level to be the first key area of price resistance on any strength.
Sector/Industry Watch
I showed the daily chart of the U.S. dollar above, highlighting the short-term breakout. Here's a longer-term version of the chart, suggesting this move higher in the dollar may just be getting started:
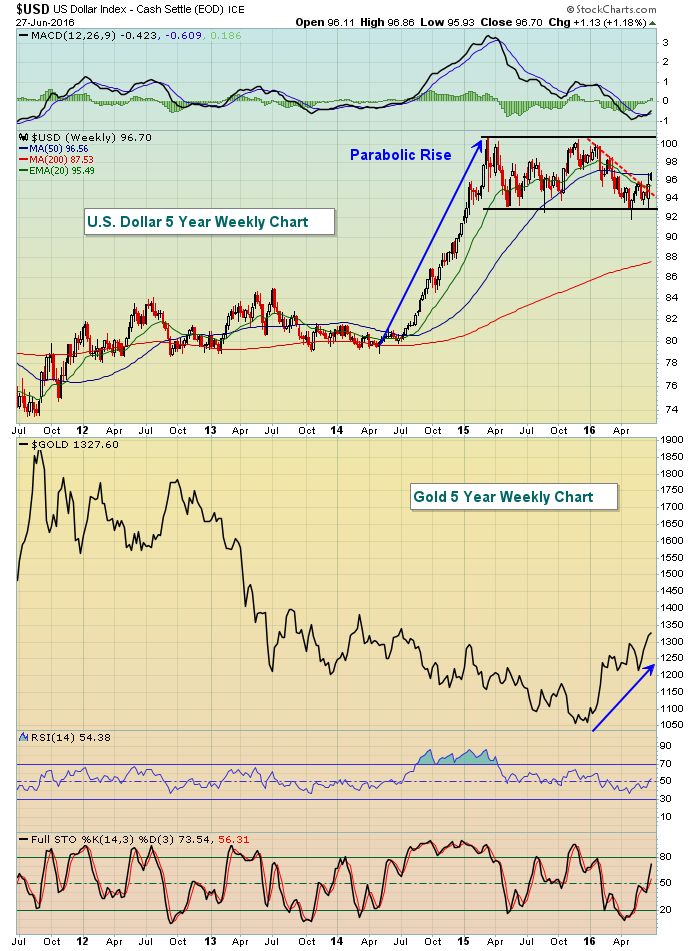 The recent downtrend in the U.S. dollar appears to have broken, increasing the likelihood of a further rise above 100 to test the high established in 2015. That potential rise in the greenback is bad news for gold ($GOLD), which has risen more than 25% during the first half of 2016 while the dollar has been drifting lower.
Historical Tendencies
The futures this morning are showing a much higher open. This isn't shocking to those who follow seasonal patterns. Check out the annualized returns on the NASDAQ (since 1971) for each of the next few calendar days:
June 28 (today): +83.54%
June 29 (Wednesday): +48.54%
June 30 (Thursday): +62.71%
July 1 (Friday): +40.49%
Key Earnings Reports
(actual vs. estimate):
CCL: .39 (estimate)
FDS: 1.64 vs 1.63
IHS: 1.27 vs 1.14
(reports after close, estimate provided):
NKE: .48
Key Economic Reports
Final Q1 GDP released at 8:30am EST: +1.1% (actual) vs. +1.0% (estimate)
April Case Shiller home price index released at 9:00am EST: +0.5% (actual) vs. +0.6% (estimate)
June consumer confidence to be released at 10:00am EST: 93.3 (estimate)
Happy trading!
Tom
