Market Recap for Tuesday, June 21, 2016
Small cap stocks did not participate in Tuesday's rally as the Russell 2000 finished lower by 0.33%. But our other major indices all gained, led by the S&P 500's 0.27% rise. Energy (XLE, +1.19%) continues to trade very well on an absolute and relative basis and that's enabled the S&P 500 to remain close to its all-time high close. The strength in energy has kept the bears at bay, despite a continuing flight to safety that typically spells doom for bull markets. Until we see price deterioration and key support levels fail, the bears will remain at a technical disadvantage. Here's a current look at the XLE:
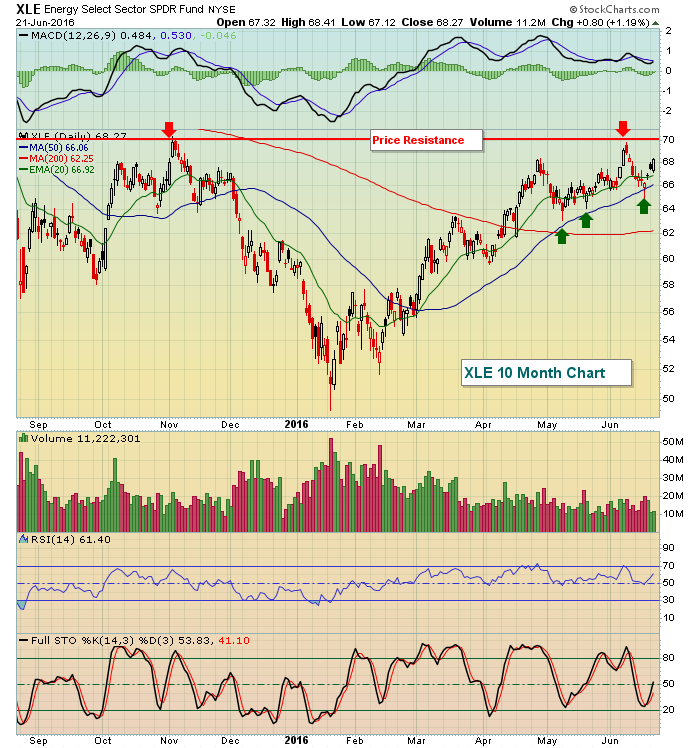 The XLE continue to trade with very strong technical behavior. The rising 50 day SMA remains the primary support while price resistance is obvious from the price highs in November and early June. One key moving forward will be the performance of the Dow Jones U.S. Pipelines Index ($DJUSPL), which is featured below in the Sector/Industry section below.
While we saw strength in certain areas on Tuesday, it was quite obvious it was not a wide participation rally. In fact, four sectors finished in negative territory with specific weakness in biotechnology stocks ($DJUSBT) sending healthcare (XLV, -0.35%) to the bottom of the sector leaderboard.
Pre-Market Action
Overnight, we saw a bit of weakness in Tokyo as the Nikkei ($NIKK) fell 0.64%. Most other key indices around the globe were or are higher and that's helped to lift Dow Jones futures, which are higher by 16 points at last check. While the British will be casting their votes tomorrow, traders continue to cast their votes on a day-to-day basis. This week's action has been bullish and futures suggest we'll see that optimism continue into today's U.S. opening bell.
Crude oil prices ($WTIC) have just moved back above $50 per barrel and that renewed strength is helping to lift futures as well. The treasury market is at an interesting point as the 10 year treasury yield ($TNX) currently stands at 1.70%, the key level I'm watching. A break above is likely to be bullish for U.S. equities, while the opposite is likely if we begin to see treasury yields drift lower from this level.
Current Outlook
Brexit remains the primary topic of discussion as the UK referendum on Thursday approaches. That could leave global markets subject to significant volatility. While the more intermediate-term trading range is from 2025-2131, the following represents the short-term trading range we want to keep an eye on:
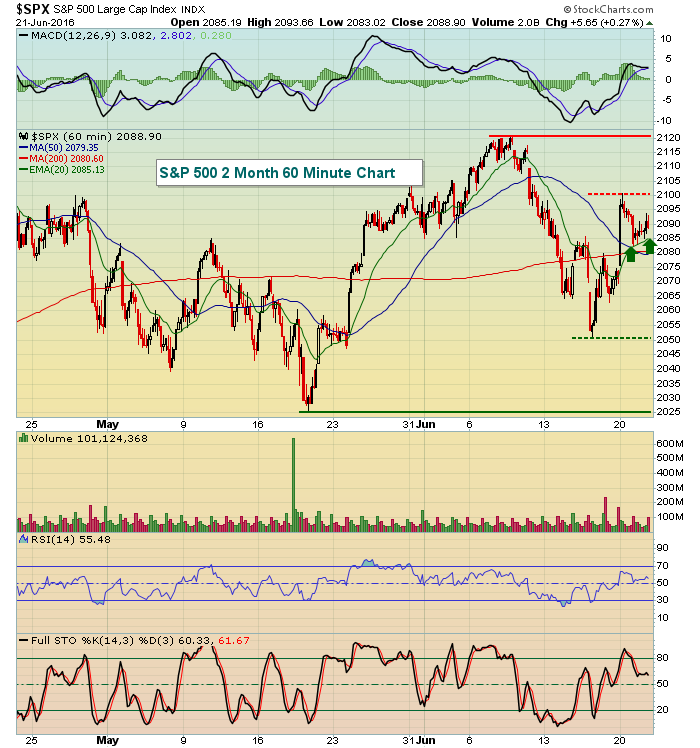 One short-term bullish sign has been the recent bounces off 20 hour EMA support (green arrows), but from a price perspective, check out the red- and green-dotted horizontal lines. Whichever of those lines is penetrated first, that's the likely direction over the intermediate-term until the longer-term price support/resistance (solid red/green horizontal lines) is tested.
Sector/Industry Watch
Energy has been strong, but pipelines ($DJUSPL) is now testing a key resistance level near 600. Check it out:
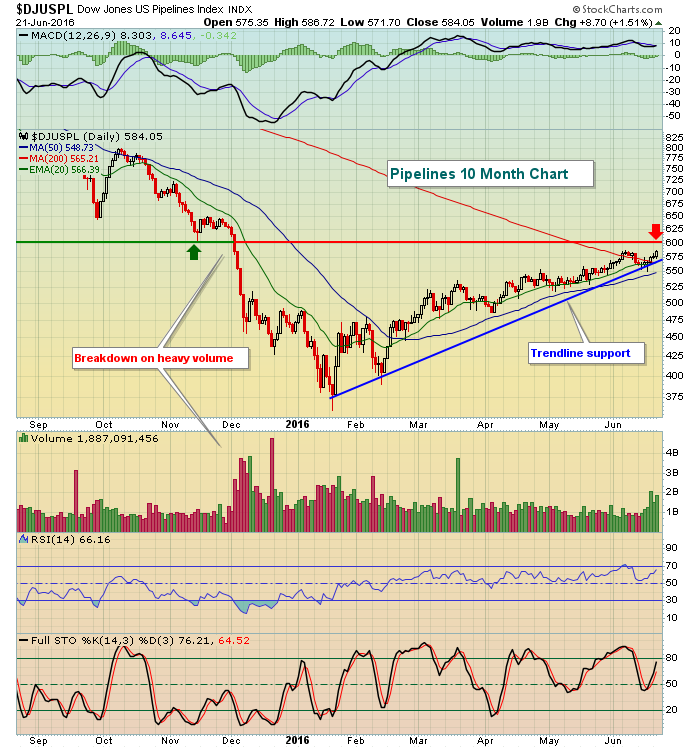 The uptrend line has been an area of accumulation on pipelines and the recent volume spike to support this latest push higher confirms that. 600 will be an area where we'll likely see selling pick up, however, so let's make sure we can negotiate that resistance level.
Historical Tendencies
The S&P 500 needs to negotiate the next three days historically before a more bullish seasonal period kicks in. Here are the annualized returns on the S&P 500 (since 1950) for each of the next three calendar days:
June 22 (today): -36.65%
June 23 (Thursday): -20.73%
June 24 (Friday): -30.51%
Key Earnings Reports
(actual vs. estimate):
WGO: .53 vs .45
(reports after close, estimate provided):
BBBY: .86
RHT: .33
Key Economic Reports
April FHFA house price index to be released at 9:00am EST: +0.6% (estimate)
May existing home sales to be released at 10:00am EST: 5,570,000 (estimate)
Happy trading!
Tom
