Market Recap for Wednesday, March 8, 2017
The S&P 500 fell for a third consecutive day and it could have been five days in a row if not for a very small gain last Friday. The culprit yesterday was quite clearly the oil patch. The U.S. crude oil inventory surged higher by 8.2 million barrels to an all-time record high of 528.4 million barrels. It was a shock as expectations called for just a 2 million barrel rise. That much higher build in inventory sent oil prices crashing lower to just above the $50 per barrel level, easily its lowest close in 2017. Here's the chart:
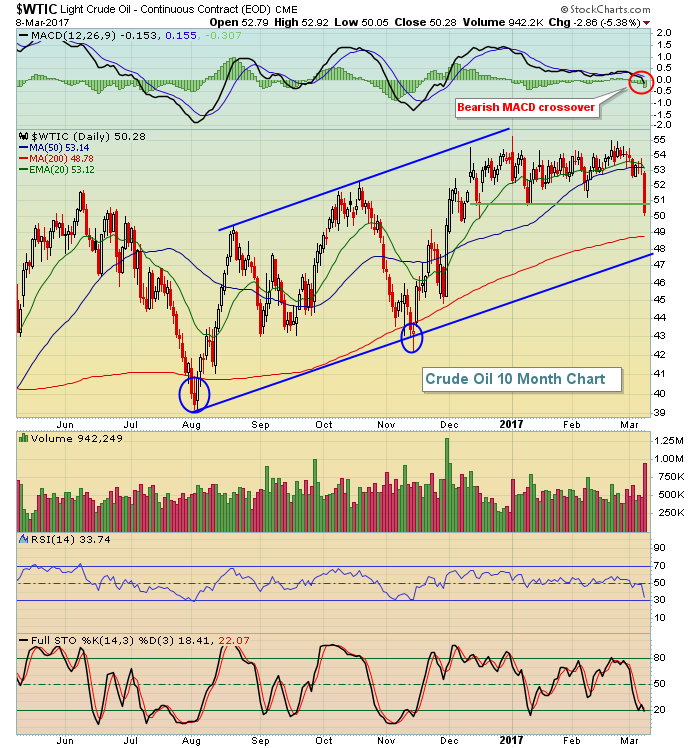 When I see a chart breakdown, I look to see where we might see a future reversal in trend. For the WTIC, I'd be looking to the $47-$48 per barrel area now that short-term price support (green horizontal line) has failed to hold. Also, the 200 day SMA has been key with the last two bottoms occurring just beneath this key long-term moving average (blue circles). If we go back to the August low, crude oil has been in an up channel. Further weakness would test the lower uptrend line just beneath $48 per barrel.
Outside of energy (XLE, -2.60%) and utilities (XLU, -1.44%), there was decent performance in U.S. equities on Wednesday. Consumer discretionary (XLY, +0.42%) bounced nicely off its 20 day EMA as I would expect. Take a look:
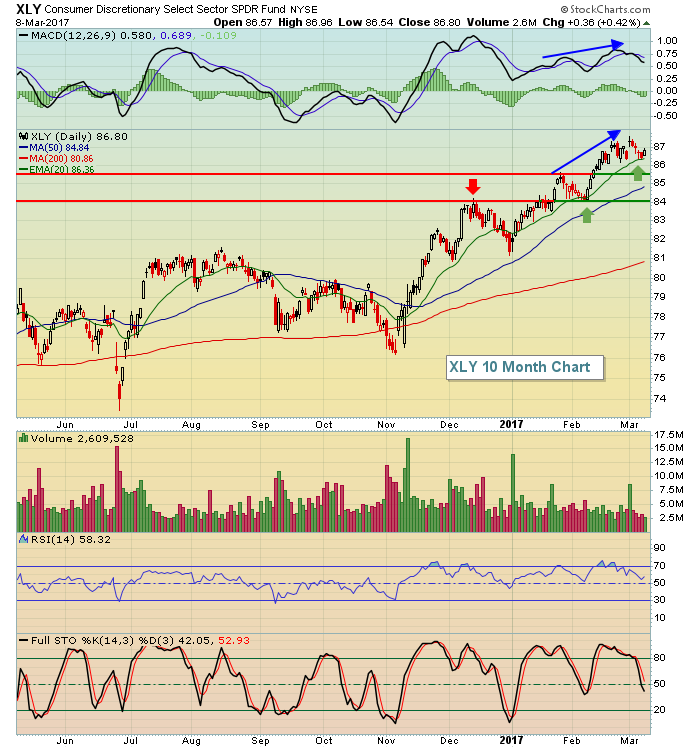 The blue directional lines show that the MACD is accelerating to the upside while price action is doing the same. That combination defines strong momentum. During periods of such strong momentum, I generally look for the rising 20 day EMA to provide support - and that's exactly what happened yesterday with the XLY. Beautiful action. Home construction ($DJUSHB) continues to lead discretionary stocks and the breakout is clear as shown below in the Sector/Industry Watch section below.
Pre-Market Action
U.S. futures are lower as crude oil's recent decline continues in pre-market trading. At just past 8am EST, the WTIC was lower by 2.39% as it closes in on $49 per barrel. In the meantime, yesterday's strong ADP employment report and the expectation of a strong government nonfarm payrolls report tomorrow morning has the 10 year treasury yield ($TNX) up another basis point to 2.56% at last check with key resistance at 2.62% literally just a few ticks away as we near another FOMC meeting next week.
Current Outlook
The S&P 500 has been weak the past several days. There are a couple of areas to look at for potential support, but first let's look at the visual:
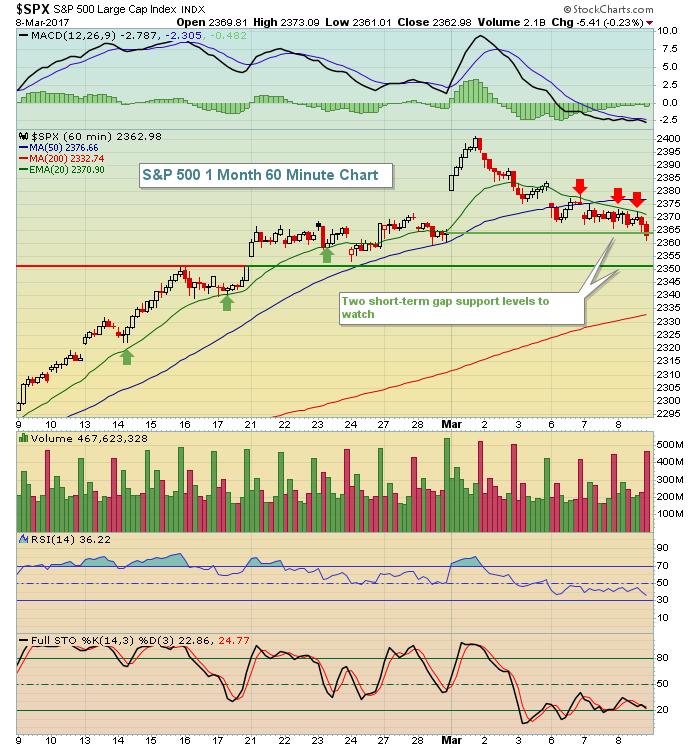 Notice that throughout the recent uptrend, the rising 20 hourly EMA provided nice support (green arrows). Now as we trend lower, the declining 20 hour EMA is a key resistance level. So from a bullish perspective, the first step is to clear this moving average....and hold it. To the downside, the two horizontal lines are drawn from key gap support levels. The close on Wednesday failed to hold the initial support level and futures this morning are lower. Therefore, I wouldn't be shocked to see equities decline and test the next gap support level - and that's currently just above 2350.
Sector/Industry Watch
The Dow Jones U.S. Home Construction Index ($DJUSHB) has become one of the most bullish industry groups over the past few weeks. We had seen consolidation for the past couple years, but the breakout on the following chart is apparent:
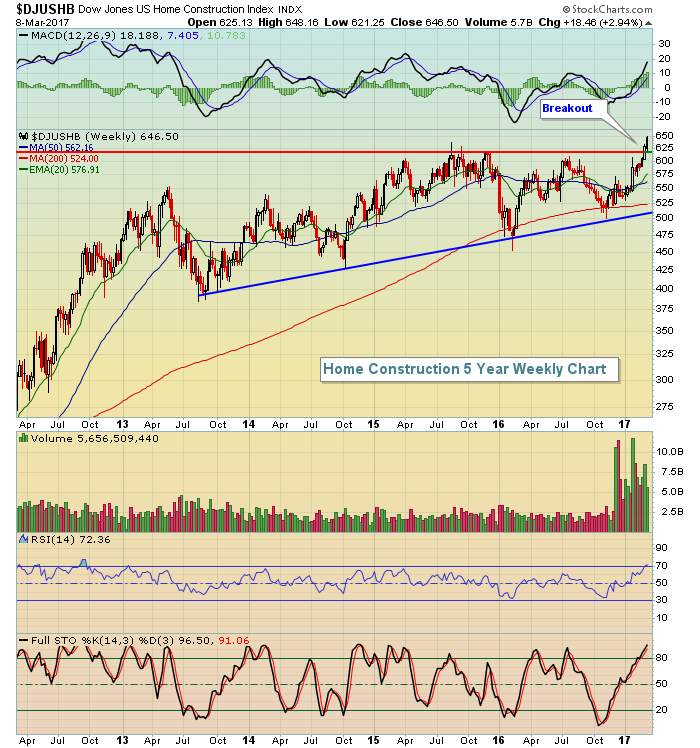 Last weekend I wrote an article on this group and discussed an ETF that tracks the group, along with a few individual stocks that would benefit from a continuing rise in the industry. You can CLICK HERE to read that article.
Historical Tendencies
I mentioned recently the tendency for equities to struggle on Mondays relative to the balance of the week. Here's a look at how the NASDAQ has traded since 1971 by calendar day of the week:
Monday: -32.37%
Tuesday: -3.68%
Wednesday: +28.31%
Thursday: +25.59%
Friday: +26.39%
Key Earnings Reports
(actual vs. estimate):
ERJ: 1.14 vs .79
IGT: .88 vs .41
SPLS: .25 vs .25
(reports after close, estimate provided):
FNSR: .51
ULTA: 2.13
Key Economic Reports
Initial jobless claims released at 8:30am EST: 243,000 (actual) vs. 238,000 (estimate)
Happy trading!
Tom
