Market Recap for Thursday, June 1, 2017
U.S. equities had a very strong day on Thursday, with the small cap Russell 2000 leading the charge with a solid 1.89% gain. The move was also widely participated in, with all nine sectors finishing higher. Financials (XLF, +1.25%), a clear relative laggard since early March, regained its relative strength yesterday as it was led higher by groups that tend to perform well in a rising interest rate environment - namely, banks ($DJUSBK), life insurance ($DJUSIL), investment services ($DJUSSB), etc.
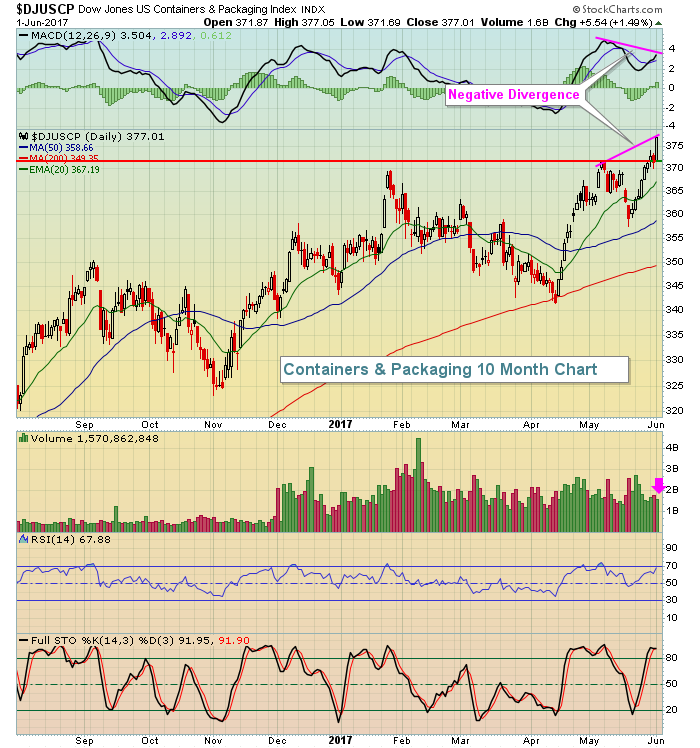
Materials (XLB, +1.21%) were a close second in terms of Thursday sector performance. Several industry groups performed well here, but containers & packaging ($DJUSCP) were notable as they made another breakout - albeit with suspicious volume and a negative divergence in play. Check it out:
 Technology (XLK, +0.25%) took a break in terms of relative strength as money rotated away from the group - at least for a day.
Pre-Market Action
It was very disappointing date from the government this morning as nonfarm payrolls came in shy of expectations. The disappointing data is reflected below in Key Economic Reports. It's not the first time that we've seen ADP data show bullish data about the economy and the nonfarm payroll report disappoint two days later. That's most likely why bond traders were not selling treasuries heavily on Wednesday after the bullish jobs data.
This morning, the 10 year treasury yield ($TNX) has reversed course and is lower by 4 basis points to 2.17%, reaching its lowest level since November 11th. Dow Jones futures are well off their earlier highs, but still remain 17 points higher as we approach the opening bell.
Overnight, we saw strength in Asia, particularly in Tokyo where the Nikkei ($NIKK) charged above 20000 for the first time since 2015. Check out the Current Outlook section below for more details on the NIKK.
Current Outlook
U.S. indices are getting a lift from global markets where we see new highs almost daily. Overnight, the Tokyo Nikkei ($NIKK) closed above 20000 for the first time since 2015 and appears ready to challenge its 2015 high of 20952. That was the highest the NIKK has closed since 1996, more than two decades ago. Here's the long-term look at the NIKK:
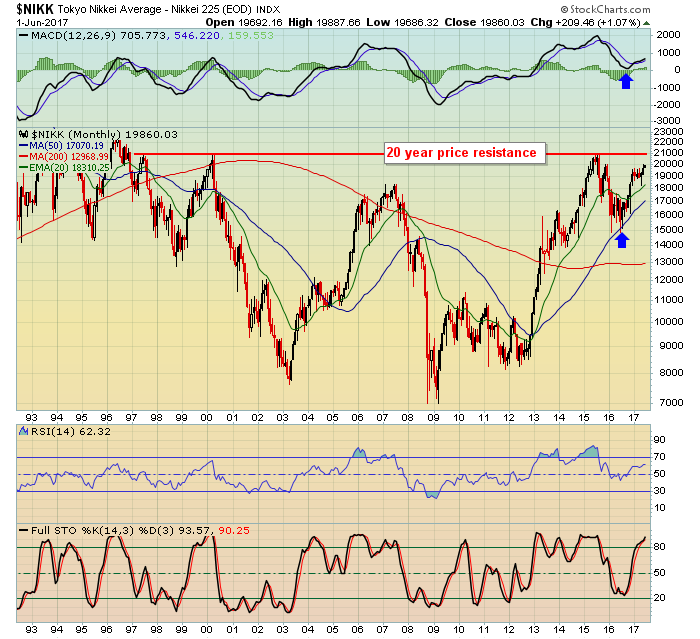 The blue arrows mark recent tests of support at the 50 month SMA and MACD centerline. Long-term momentum is now moving higher and monthly RSI is only at 62, not yet overbought. Therefore, I'd expect this longer-term uptrend to continue to at least test that 21000 level.
Sector/Industry Watch
Gambling stocks ($DJUSCA) broke out of a bull flag pattern on Thursday and appear poised for further gains ahead. Take a look at the chart:
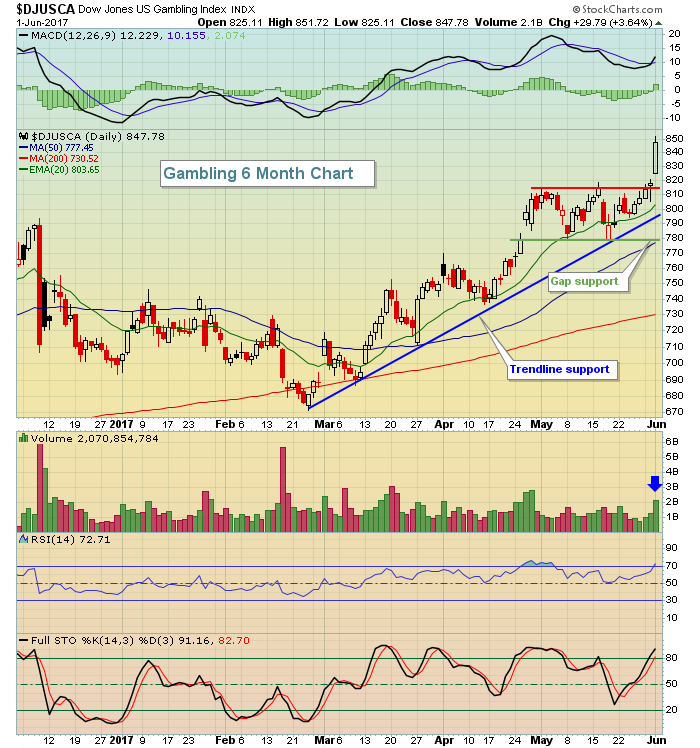 The gambling industry consolidated in mostly sideways fashion during May after a steady climb in the second half of April. While there was technically a slight breakout on Wednesday, Thursday's move was much more impressive and occurred with heavy confirming volume (blue arrow). The DJUSCA has moved into overbought territory so keep an eye on the rising 20 day EMA, currently at 803 and rising trendline support, just below 800, for key short-term support.
3Historical Tendencies
Yesterday, I discussed how June is a very average month in terms of NASDAQ performance since 1971. Here's a breakdown as to annualized performance during various parts of the month:
June 1 - June 5: +54.63%
June 6 - June 26: -11.14%
June 27 - June 30: +53.56%
This is quite typical of most calendar months. We see a lot of bullishness to open a month and close a month and not much bullishness in between - other than money flow related bullishness near the middle of the month. It's also why, as a trader, I don't buy into the "Go away in May" theory. For traders, there are many opportunities throughout the summer from a historical perspective.
Key Earnings Reports
None
Key Economic Reports
May nonfarm payrolls released at 8:30am EST: 138,000 (actual) vs. 185,000 (estimate)
May nonfarm private payrolls released at 8:30am EST: 147,000 (actual) vs. 174,000 (estimate)
May unemployment rate released at 8:30am EST: 4.3% (actual) vs. 4.4% (estimate)
May average hourly earnings released at 8:30am EST: +0.2% (actual) vs. +0.2% (estimate)
Happy trading!
Tom
