The webinar last week discussed some significant lows in the $CRB index. The commodity index recorded the second lowest weekly close in 40 years. We'll see how the week/month finishes out, but it closed Friday, November 20th only 2 handles above the 40-year lows of $181.
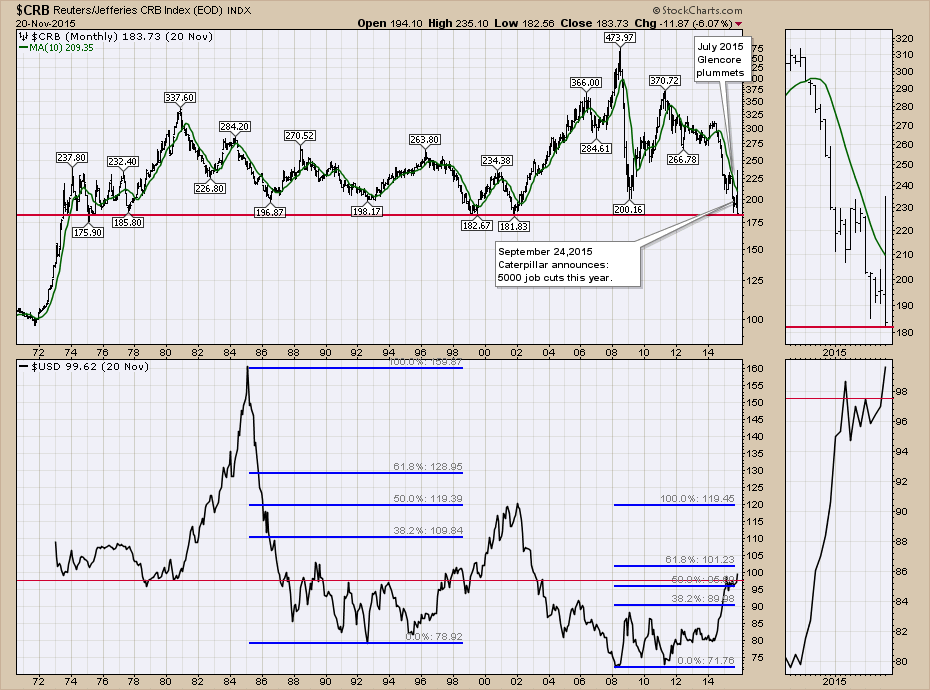
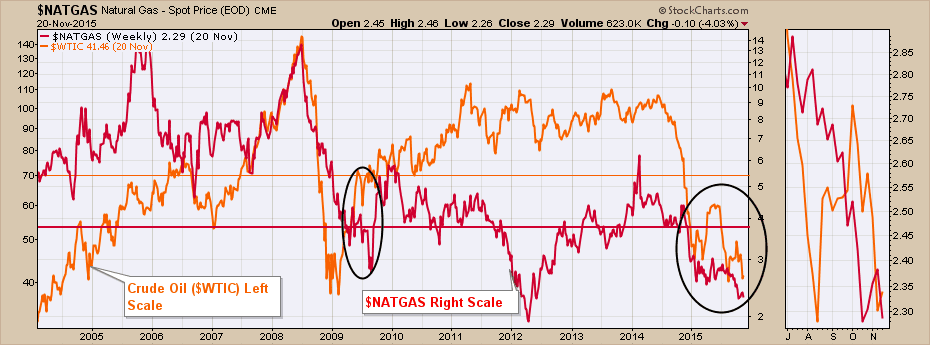
Energy is a major component of the $CRB. One very important hurdle for the energy sector as we stare at year-end is the accounting treatment for the stocks. Currently, Natural Gas is about 40% below marginal cost (see the horizontal red line compared to red price plot using the scale on the right). Currently, Oil is also about 40% below marginal cost (see the horizontal orange line compared to orange price plot on left scale). The problem is the companies need to value the assets of the corporation at year end based on average prices and realised prices. Examples would be the average price over the last 6 or 12 months. The important thing to note is that in 2009, the prices of both products were below the marginal cost of production for only a few months. By the end of the year, the prices had bounced back above the moving averages so the year end numbers were damaged but there was some ballast for realised prices. This created some optimism that things were better. Looking at 2015, unhedged companies will have been below average marginal costs for the entire year on both products.
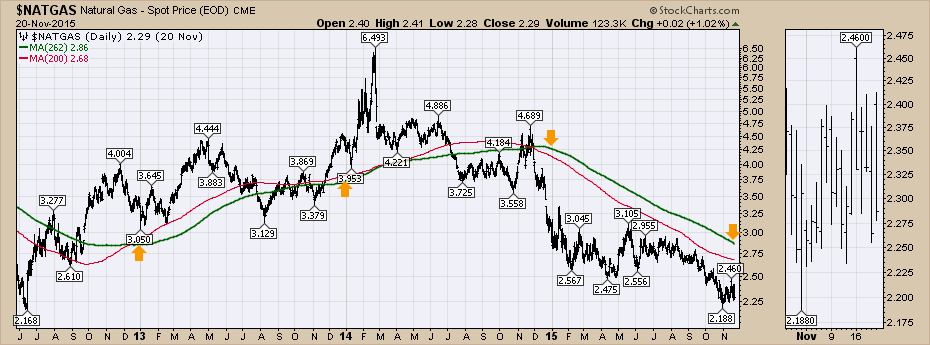
Below is Natural Gas with arrows pointing to the year end prices. The green line is the one year average. We can see that this will be the lowest value for the natural gas assets in the ground since 2012 year end, but the drop from 2014 year end to 2015 is significant. It has moved down from $4.25 to about $2.86. We can also see the 200 DMA in red showing a more likely year-end average of $2.70.
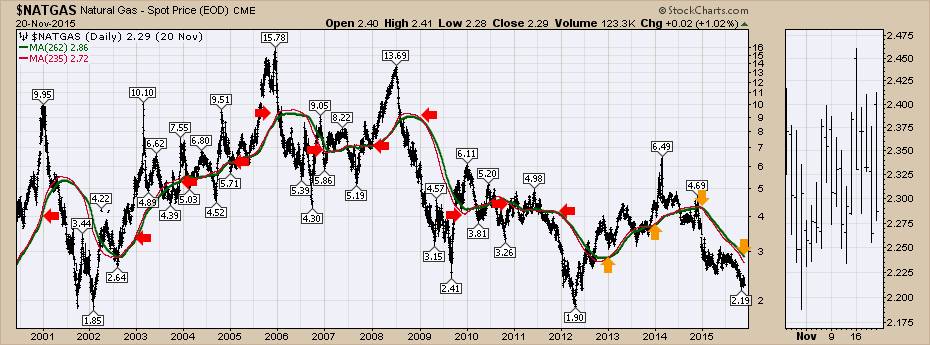
Here is the longer term chart for $NATGAS. In 2002 and 2013, the price was well above the average so the latest realised prices would have helped the calculation. This year, the current price is well below the average so this will not aid, but hurt the actual reserves calculation. This will be the lowest year-end averages and prices this century unless something dramatic changes the price structure.
Below is the chart for oil. I also published this at the end of October on the Canadian Technician article. We are now a month later and the price continues to test the lows. Now the year-end averages are almost $10 below the 2009 year-end averages. We are currently at $52 for the one year average and $50 for the 200 DMA average. We ended 2014 with a valuation of $93 on the year-end average. As the current price of oil is well below the average and each day we are dropping a higher price on the average from last year in the middle of the decline, we probably won't exceed these levels enough to turn the averages up. That would mean that oil assets in the ground will have an asset valuation calculation with 30% - 40% change per barrel as a base case. When production costs are removed there is not much skin on the bone and only reserves that are viable at the current price can be included.
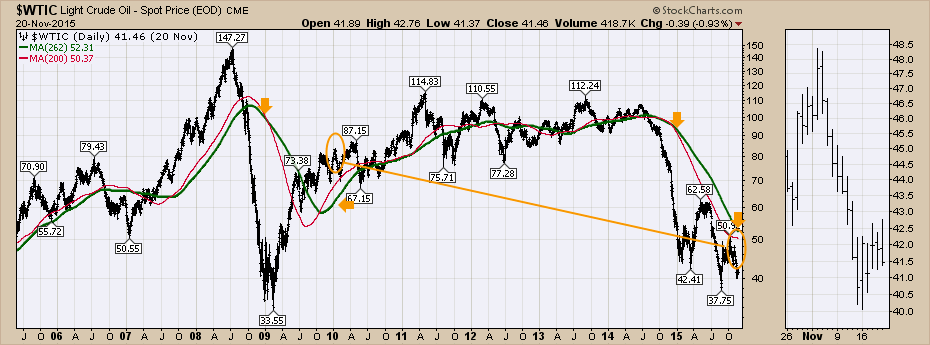
One of the real problems is that both Natural Gas and Oil look to have lower average year-end prices than at any time since 2004 and they are occurring at the same time. This write-down of assets is material and also reflects a company's access to debt markets. The asset size of the industry is coming down dramatically. Oil and Gas Companies can only report reserves that are economically viable. In the short term, if the market price was above the average, this could positively affect calculations. With the current prices at the low end of the year, the 12-month average might be better. They also have a calculation for realised prices, which is usually below the averages because of transportation costs as an example. Some US companies have been able to lower drilling and production costs by working with (pommelling) their suppliers for lower prices. In Canada, the weak Canadian Loonie makes supplies more expensive which offsets most of the savings of lower costs from suppliers.
To truly understand the financial conditions of the exploration company you are investing in, you may want to wait until their next reserve report is released. A reserves report has to be reviewed and verified by an independent firm once a year. This is usually calculated in the first quarter and published. While the price of oil may wiggle around between $40-$50, the reserves calculation changes could wipe out a significant amount of the reserves or asset valuations of any company in the industry group. Any reservoirs that have been omitted from the reserves report are not viable at current or average prices. I have tried to simplify this so don't focus on the exact value of the numbers. The trend is down and you may wish to consult financial experts if all of this matters to your investment plans. The real point is to be very careful getting bullish on exploration and production companies. Just based on the charts above, this will be the single biggest year for asset writedowns on both the oil side and the gas side of the business in a long, long time. We have a month to go before the final details are in.
Join me on the Canadian Technician Webinar Tuesday, November 24th, in the afternoon at 5 EST. Click here to register. The Canadian Technician Webinar.
Good trading,
Greg Schnell, CMT