Yesterday's 9.4% rally in the S&P 500 Index has many investors wondering whether a bottom has been put in place in the markets. Certainly, the fear among the U.S. population has hit new highs, and we now have a historical stimulus package close to being passed. Could yesterday's sharp rally out of an oversold position in the broader markets be the bear market bottom?
While it would be enticing to think that the sharp coronavirus-induced selloff is now ready to reverse, history tells us otherwise. From my work, I've been using the 2008-09 bear market as precedent given the highly volatile and sharp selloff amid the intense fear of a financial collapse that is similar to the current market.
DAILY CHART OF S&P 500 FROM JULY 2008 - MARCH 2009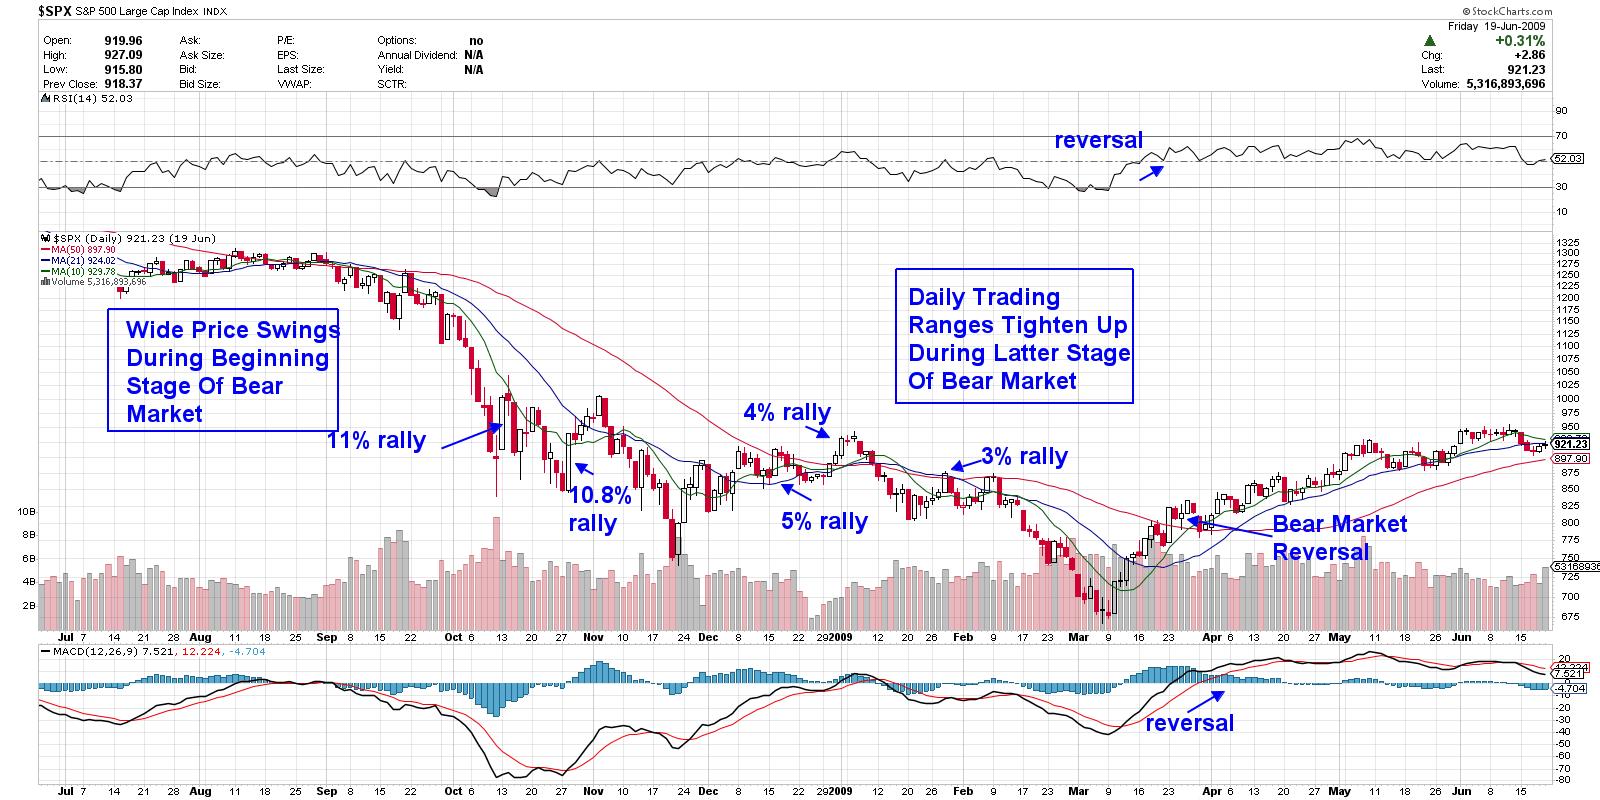
As you can see in the chart above, wide daily price swings, such as those we've experienced over the past month, are typical of the beginning phase of the 2008 bear market as emotional traders react to every headline amid the intense uncertainty. Currently, we've seen 11% rallies on two occasions in the S&P 500, with two 10.5% declines over the last 10 trading days alone.
Going back in time, as the uncertainty surrounding the 2008 crisis began to stabilize, we see the daily price swings tighten up considerably, which allows the markets to build a more sound base from which to post a sharp downtrend reversal. As you can see, I've also highlighted the telltale signs of the actual bear market reversal in March 2009.
While my work uses many other metrics from a proven system that's identified every bear market bottom, the price swings on a daily chart is certainly a good start, as it tells us that emotions are still running quite high, which in turn will keep volatility extended over the near-term.
The good news is these wide range price swings on a regular basis are creating tremendous opportunities for nimble traders, who know how to pinpoint precise entry and exit points in select areas that are under demand. If you'd like to be alerted to a daily live trading room that I'm setting up at no charge, please provide your contact information here by going to Contact Us from my website.
And for those who'd like to be alerted to broader market sentiment as well as attractive trade setups in this market, I urge you to trial my bi-weekly MEM Edge Report for 4 weeks for a nominal fee. We've been providing additional alerts regularly. Sign up today and you'll receive the 3 reports from this week immediately!
Warmly,
Mary Ellen McGonagle,
MEM Investment Research